


Funding Trends & Support of Guiding Principles
This Funding Trends report presents data on several parts of the NIDDK portfolio, includes highlights of areas where advances have been made, and recognizes areas where opportunities for enhancement remain. The report presents a 10-year review covering FY2014-FY2023 and focuses on the first four of the five NIDDK core values.
NIDDK is dedicated to supporting multi-faceted research efforts within our mission, including diabetes and other endocrine and metabolic diseases, liver and other digestive diseases, nutritional disorders, obesity, kidney and urologic diseases, and hematologic diseases. Our commitment to a diverse research portfolio covers not only basic, translational, and clinical research, but also our dedication to research training and career development, as well as the dissemination of research findings that would improve the lives of patients with various diseases, caregivers, and others who may be at risk.
Except for Figures 1, 2, 9, & 10 (which include initiative data), the data in all charts exclude initiatives (i.e., Requests for Applications, or RFAs). In addition, the data presented in this review do not include grants funded through the Special Statutory Funding Program for Type 1 Diabetes Research (see About the Special Diabetes Program).
Executive Summary
The NIDDK budget has increased steadily since FY2013. NIDDK’s appropriation was approximately $2.3 billion in FY2023, excluding the $141.5 million appropriation associated with Special Statutory Type 1 Diabetes (T1D) funding. Historically, the flattening of the NIH budget from FY2003-2008 (post-doubling era) and then sequestration in FY2013, resulted in a decrease in the number of awards in several categories because costs associated with performing research outpaced budget increases. As appropriated budgets increased from FY2013 to present, NIDDK was able to increase the number of awards and principal investigators (PIs) supported. The number of R01 awards and R01-supported PIs rose and reached historic highs in FY2023. Spending on R01 awards has increased by 63% from FY2014 to FY2023. This reflects the costs associated with supporting more awards and also increases in the average cost of R01 awards. The average costs of R01 awards have increased due to several factors including inflation, a shift to multi-PI awards, and decreases in the proportion of grants that are competitive renewals and/or that have modular budgets.
In support of the goal to promote a diverse pool of talented new investigators, in FY2023 NIDDK continued to prioritize its support of Early Stage Investigators (ESIs). Since FY2020, NIDDK has supported a payline for ESIs at the 25th percentile, leading to more ESI applications receiving funding. While the trend is nascent and a causal relationship cannot be clearly established, there have been decreases in the mean age of the R01 PIs in FY2020 through FY2022, but a noted increase in FY2023. While support of ESIs has been enhanced, review of demographic data for R01 PIs shows that there remains a persistent gap in the number of applications submitted by and awarded to applicants who self-identify as Black or African-American. Work to enhance workforce inclusion is ongoing.
Aligned with its stated principle, NIDDK has continued robust support of research involving human subjects and clinical trials. Compared with FY2014, in FY2023, NIDDK increased spending by 75% and supported 83% more projects on research that included clinical trial components.
Regarding training, NIDDK leverages several mechanisms to support a wide array of trainees from graduate students to physician researchers. From FY2014 to FY2023, NIDDK has awarded almost $1.3 billion in support of trainees across various training awards. Several conflicting trends are emerging, with a substantial increase in the number of F31 awards but a decrease in the number of F32 awards annually. The number of T32 trainees also has continued to decline, partially explained by the use of an alternative mechanism to support training by one of our programmatic divisions.
Core Value: Maintain a Vigorous Investigator-Initiated Research Portfolio
In FY2023, approximately 86% of the NIDDK $2.3 billion appropriation (not including Special Diabetes Program funding) was spent in support of extramural research. The NIDDK portfolio leverages key mechanisms (i.e., grants, cooperative agreements, and contracts) and many mechanism activities to support its extramural programs. The various mechanisms are used to support specific types of research, training, and research support. Examples of some of the NIDDK portfolio funding mechanisms and the activities/activity codes that are used are listed below (See the complete list and description of NIH activity codes):
- Research Project Grants (RPGs) - R01, R03, R15, R21, R34, R37, R56, RC2, as well as U01, U34, UC2, UG3, UH3, UM1, P01, and DP1 awards
- Small Business Innovation Research/Small Business Technology Transfer (SBIR/STTR) - including R41, R42, R43, and R44 awards
- Research Centers - Includes P20, P30, P50, U42 and U54 awards
- Research Careers - Includes all K awards (including K99/R00 awards)
- Training - Includes all F and T activities
- Other Research - Activity codes not captured in other mechanisms, including R13, R18, R24, R25, U24, and U2C awards
- Contracts and Interagency Agreements (IAAs)- Includes some large clinical studies
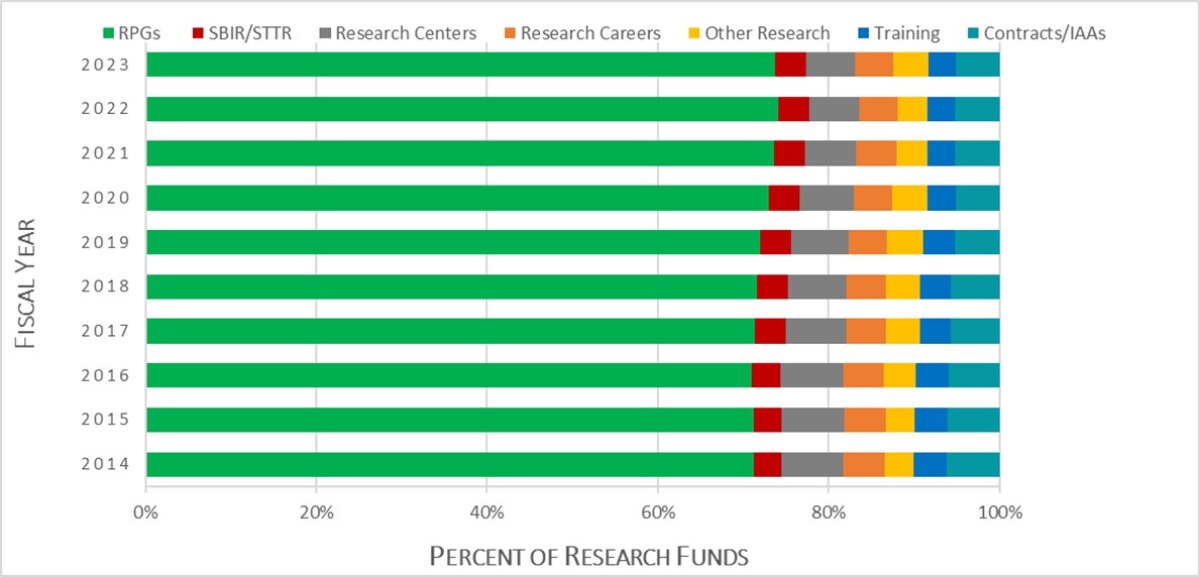
Figure 1 presents the trends in the use of different funding mechanisms to support extramural research over the past decade; the trends have remained relatively stable. Given the focus on the investigator-initiated research portfolio (as a core value), a large portion (~70%) of NIDDK’s research portfolio is focused on RPGs (especially R01 awards). Other categories of awards comprise the remaining 30% of the extramural budget. It should be noted that the SBIR/STTR allocation is congressionally mandated and must be 3.65% of the annual extramural allocation. NIDDK regularly reviews its research portfolio and makes strategic adjustments as needed based on scientific and programmatic balance considerations.
Figure 1. NIDDK Extramural Research Funding by Mechanisms (excluding Special Statutory Type 1 Diabetes Program) From FY2014 to FY2023
Accessible Image Description
Figure 1: Extramural Research Budget by Funding Mechanism. Represents the percentage of the extramural research funding by mechanism between FY2014-FY2023. Abbreviations: Research Project Grants (RPGs), Small Business Innovation Research/Small Business Technology Transfer (SBIR/STTR), Interagency Agreement (IAA). Data excludes NIDDK Special Statutory Type 1 Diabetes Program allocation.
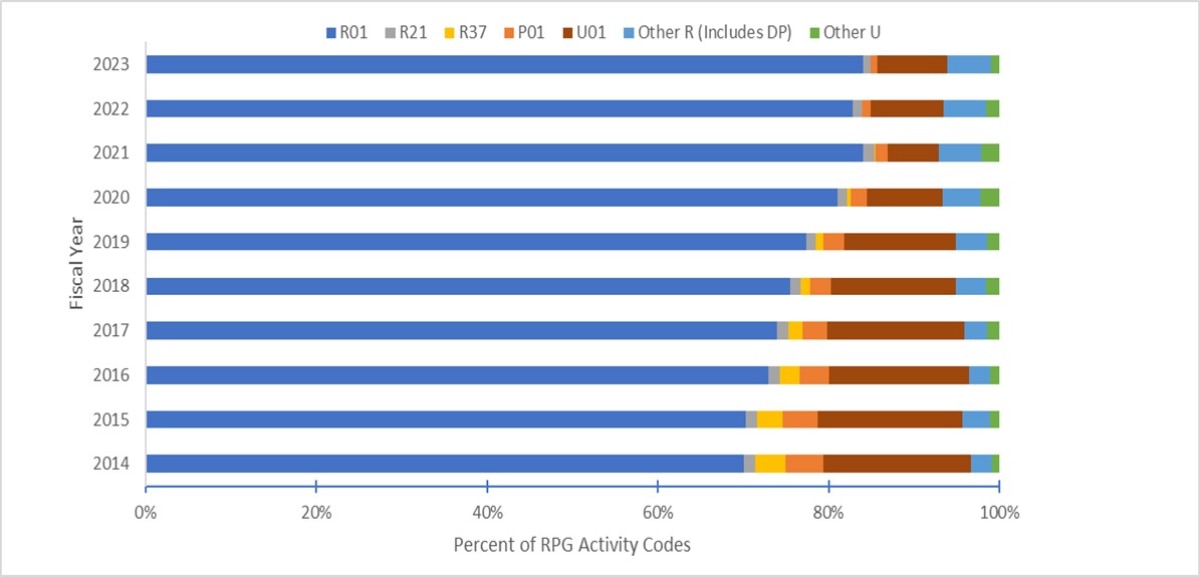
As noted above, the RPG category includes several different activity codes. NIDDK uses R01 awards more than any other award type (Fig. 2). Total cost support of R01 awards has steadily increased from 70% of total RPG costs in FY2014 to 84% in FY2023. A number of factors likely explain this trend: 1) during this 10 year window, NIDDK phased out the use of R37 (MERIT awards) and P01s (Program Project grants) and shifted the funding to support more R01s and other “team science” programs; 2) NIDDK increased its payline for both established investigators and ESIs in support of its Core Value of maintaining a vigorous investigator-initiated research portfolio; 3) COVID-19 affected spending rates of some large consortia (U01s), resulting in short-term adjustments of their budgets.
Figure 2: NIDDK Research Project Grants Funding by Activity Codes (Competing and Non-Competing, excluding Special Statutory Type 1 Diabetes Program) from FY2014 to FY2023
Accessible Image Description
Figure 2: NIDDK RPG Funding (excluding T1D), by Percent and Select Activity Codes, from FY2014 to FY2023. Relative proportion of funding levels of various RPG activity codes. Data excludes NIDDK’s Special Statutory Type 1 Diabetes Program allocation. NIDDK Research Project Grant Activity Codes: R01 – The most common type of Research Project Grant funded by the NIH; R21 – Exploratory/Developmental Research Grant; R37 – Method to Extend Research in Time (MERIT) Grant; P01 – Research Program Project Grant; U01 – Research Project Cooperative Agreement; Other R in RPGs – Includes R00, R03, R15, R34, R56, RC2, and DP grants; Other U in RPGs – Includes U34, UG3, UH3, and UM1 grants.
Most grant and cooperative agreement applications submitted to NIH receive a numeric “impact score” assigned by peer reviewers (1 – 9 scale), where lower scores indicate reviewer assessment of higher merit/fewer weaknesses. Those applications assessed to fall within the lower half in terms of merit are often “streamlined” and do not receive a numeric score (i.e., they are “unscored”). For most R01 applications, these impact scores are translated into percentile rank scores. Streamlined R01 applications do not receive a percentile ranking. (For more information, visit: NIH Grants & Funding- Peer Review: Scoring.)
Each fiscal year, NIDDK publishes its Funding Policy and uses the percentile score as a key piece of information to inform funding decisions. NIDDK has established R01 paylines for five classes of applications: 1) general applications requesting less than $500K, 2) applications requesting more than $500K, 3) New Investigator applications, 4) ESI applications, and 5) ESI First Competitive Renewal applications. Table 1 includes NIDDK R01 paylines from FY2011-FY2023. As part of its core value to maintain a vigorous investigator-initiated research portfolio, NIDDK strives to maintain healthy R01 paylines. Of note, the ESI payline was increased by 7-points (to the 25th percentile) in FY2020. This enhanced ESI payline, at the 25th percentile, has now been maintained for the past four fiscal years.
Table 1: NIDDK Investigator-Initiated R01 Paylines
| Fiscal Year | General Payline |
$>500K Payline |
New Investigator Payline |
Early Stage Investigator (ESI) Payline |
ESI First Competitive Renewal Payline |
|---|---|---|---|---|---|
| 2011 | 15 | 10 | 17 | -- | -- |
| 2012 | 13 | 9 | 13 | 18 | -- |
| 2013 | 11 | 7 | 11 | 16 | -- |
| 2014 | 13 | 8 | 13 | 18 | -- |
| 2015 | 13 | 8 | 13 | 18 | 15 |
| 2016 | 13 | 8 | 13 | 18 | 15 |
| 2017 | 12 | 7 | 12 | 17 | 15 |
| 2018 | 13 | 8 | 13 | 18 | 16 |
| 2019 | 13 | 8 | 13 | 18 | 16 |
| 2020 | 16 | 10 | 16 | 25 | 19 |
| 2021 | 16 | 10 | 16 | 25 | 19 |
| 2022 | 16 | 10 | 16 | 25 | 19 |
| 2023 | 16 | 10 | 16 | 25 | 19 |
Accessible Description
Table 1: NIDDK R01 paylines. NIDDK establishes and reports investigator-initiated R01 paylines by category: General Payline, Grants with >$500K budgets, New Investigators, Early Stage Investigators (ESIs), and ESI First Competitive Renewal by fiscal year. For each group, the payline is set each fiscal year and is used as a guide in awarding R01 applications based on percentile score.
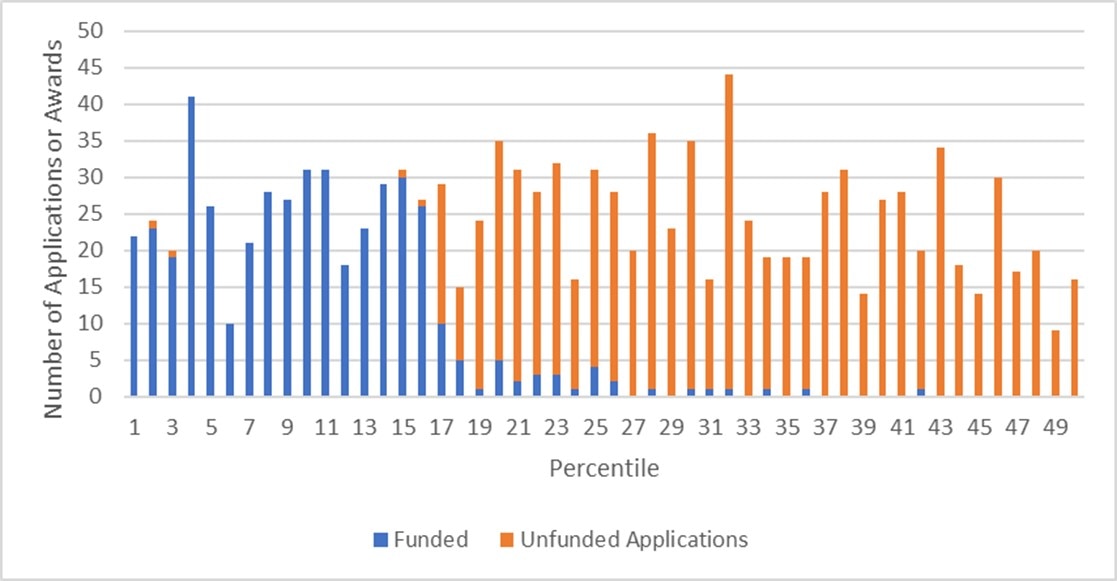
Data for NIDDK investigator-initiated (excluding ESI) R01 applications considered under the General Payline in FY2023 are shown in Figure 3A. This chart displays all NIDDK investigator initiated R01 applications that scored 50th percentile or better. All unscored applications, scored applications with no percentiles, and applications scoring above the 50th percentile are not reflected in this chart. While NIDDK closely adheres to its payline, the institute exercises programmatic discretion to skip some grants within the payline and to support programmatically important applications beyond the general payline. NIDDK funded 99% (n=405) of all grants (excluding ESI) that received a percentile score of 1-16 and funded 5% (n=43) of the R01 applications (excluding ESI) that scored beyond the 16th percentile.
Figure 3A: Number of NIDDK Investigator-Initiated (excluding ESI) R01 Applications and Competing Awards in FY2023 By Percentile Score
Accessible Image Description
Figure 3A: Investigator-initiated (Excluding ESIs) R01 Awards (blue) and Unfunded (orange) applications by percentile.
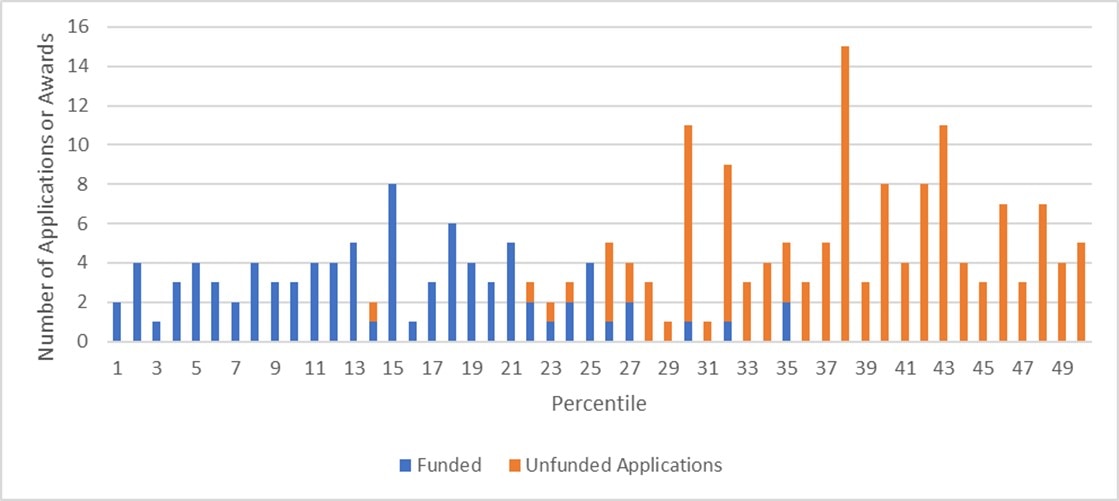
As indicated above, the NIDDK payline for ESI applications is the 25th percentile. Figure 3B focuses exclusively on ESI R01 applications. NIDDK funded 95% (n=82) of all ESI applications that received a percentile score of 1-25 and funded 4% (n=7) of the ESI R01 applications beyond the 25th percentile. It is again important to note that the institute exercises programmatic discretion to skip some grants within the payline and to support programmatically important applications beyond the payline.
Figure 3B: Number of NIDDK Early Stage Investigator (ESI)-Initiated R01 Applications and Competing Awards in FY2023 By Percentile Score
Accessible Image Description
Figure 3B: Early Stage Investigator (ESI)-initiated R01 Awards (blue) and Unfunded ESI applications (orange) by percentile.
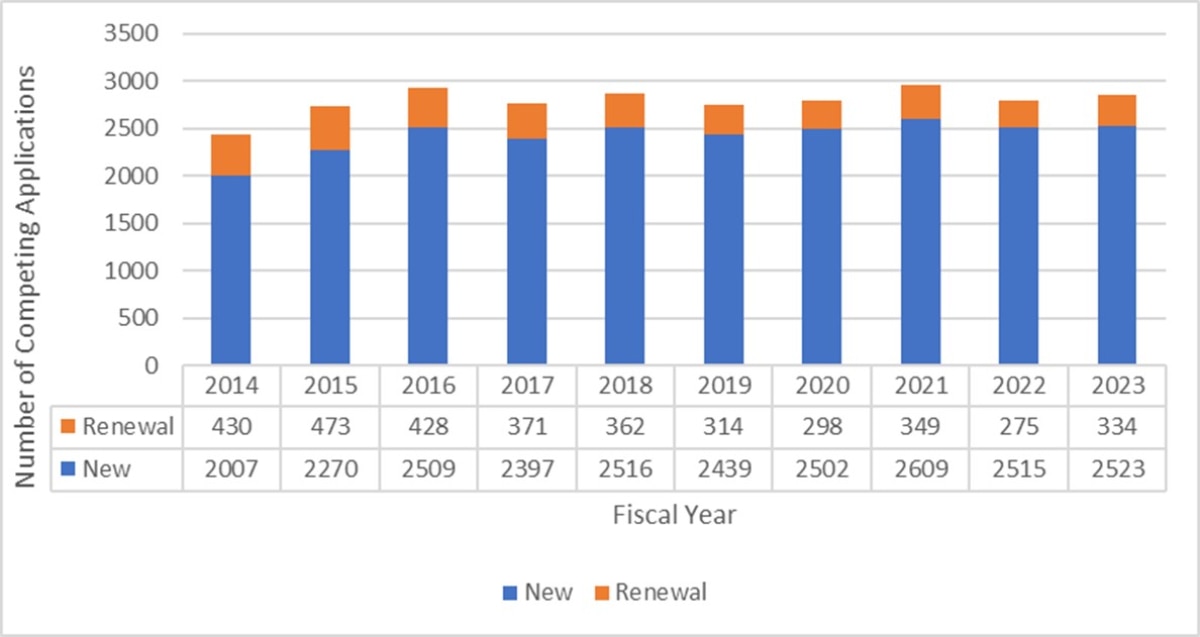
As shown in Figure 4, the number of R01 applications assigned to NIDDK increased from FY2014 to FY2016 and then remained relatively stable through FY2023. Data in Figure 4 also show an increase in proportion of “new” compared to “renewal” R01 applications received by NIDDK between FY2014 and FY2023. New R01 applications have increased from 2,007 in FY2014 to 2,523 in FY2023, a 26% increase. Conversely, the number of R01 renewal applications (applications requesting funding to continue research along the same long-term goals, but with updated specific aims) have decreased from 430 applications in FY2014 to 334 in FY2023, a 22% decrease. The overall percentage of renewal R01 applications received by NIDDK decreased from 18% of all R01 applications in FY2014 to 12% of all R01 applications received by NIDDK in FY2023, indicating a shift to submitting more new applications instead of renewals by investigators.
Figure 4: Number of Competing NIDDK R01 Applications Received for Funding from FY2014-FY2023
Accessible Image Description
Figure 4: Number of competing New (blue) and Renewal (orange) NIDDK R01 applications by Fiscal Year.
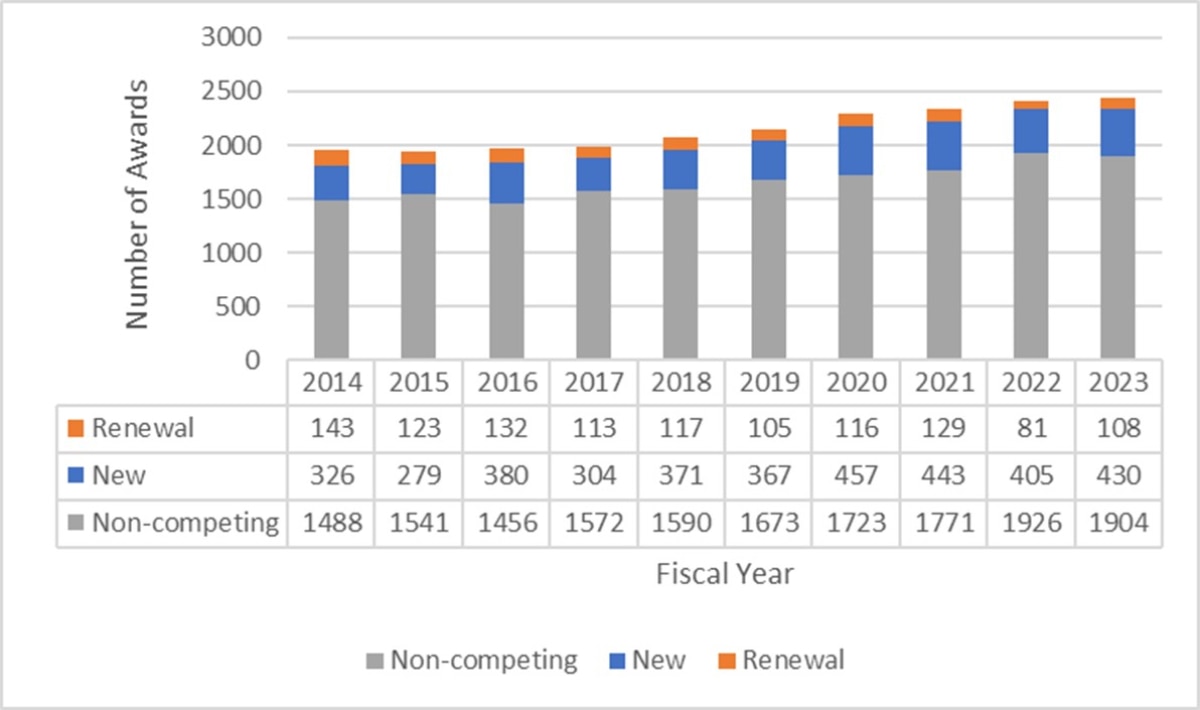
As shown in Figure 5, from FY2014 to FY2023 there was a 25% increase in the number of R01 awards (competing and non-competing) supported by NIDDK. In FY2023, the number of R01 awards supported by NIDDK reached a new all-time high of 2,442. The proportion of non-competing R01 awards was 77% of all R01 awards made between FY2014 and FY2023, while the proportions of new and renewal awards was 17% and 5% of R01 awards, respectively, during this timeframe.
Figure 5: Total Number of NIDDK R01 Awards from FY2014-FY2023
Accessible Image Description
Figure 5: Total NIDDK Noncompeting (gray), New (blue), and Renewal (orange) R01 awards by Fiscal Year.
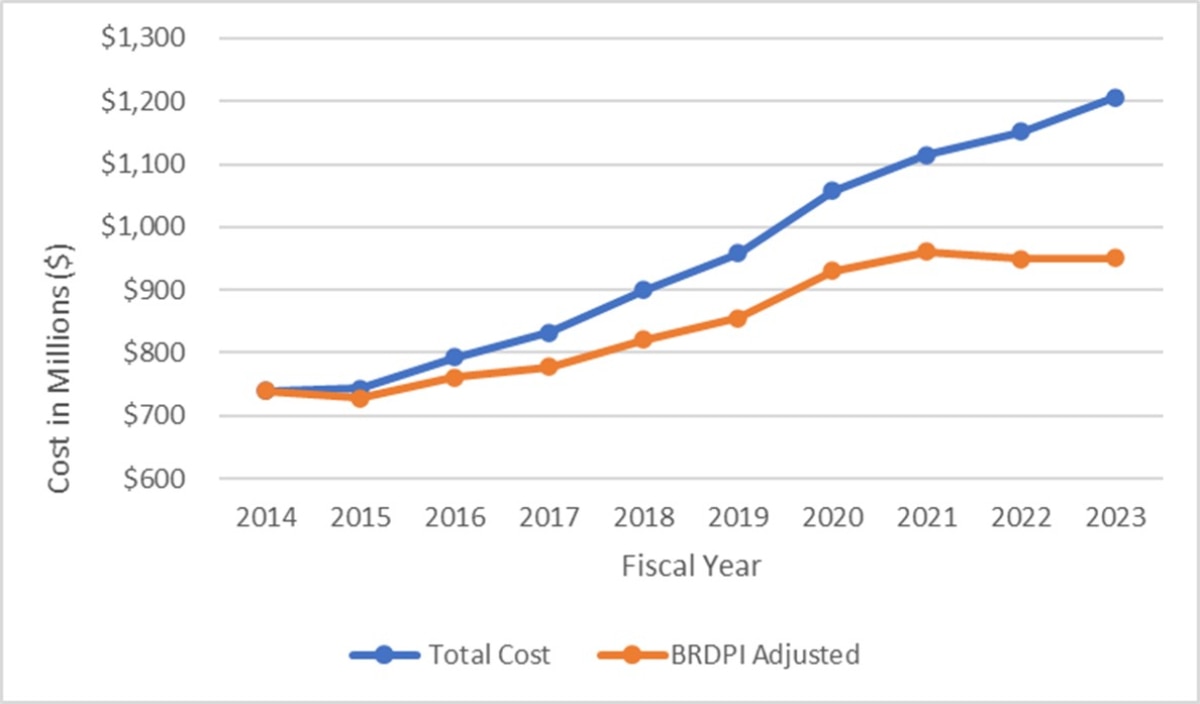
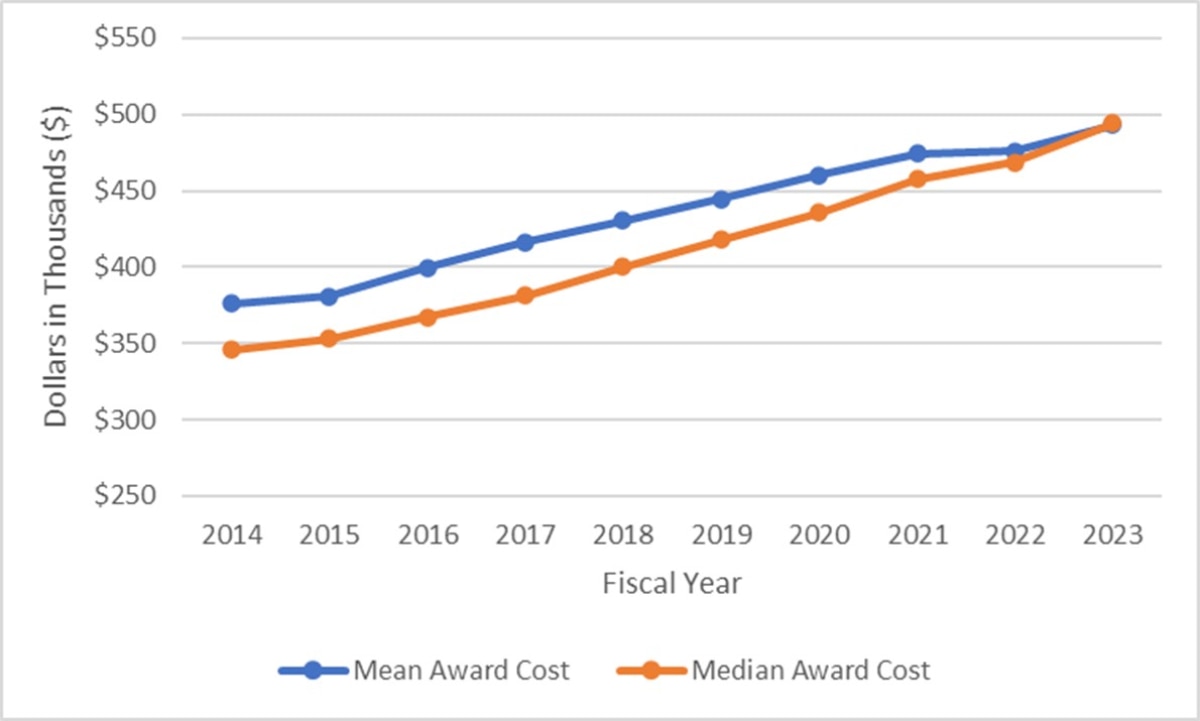
Figure 6 shows total award costs (direct and indirect) associated with support of NIDDK competing and non-competing R01s by NIDDK from FY2014 to FY2023. Nominal NIDDK R01 spending has increased from $739 million to $1.2 billion from FY2014 to FY2023, an increase of 63%, though after adjustment for inflation using the Biomedical Research and Development Price Index (BRDPI), the corrected increase was approximately 29%. While spending on the R01 portfolio has increased, the average cost of the R01 grants has also increased over the last ten fiscal years (Fig. 7). In FY2014, the mean total cost of an R01 grant was about $375,000 compared to the $493,000 mean cost of an R01 grant in FY2023 (a 31% increase). The median R01 total costs also increased with a similar trajectory over those 10 years.
Figure 6: Total NIDDK R01 Award Costs, Competing and Non-competing (Includes Direct and Indirect Costs) with adjustments for inflation from FY2014-FY2023
Accessible Image Description
Figure 6: NIDDK R01 grant total spending (direct and indirect funds) with adjustment for inflation. R01 total costs (blue), from FY2014 to FY2023. The Biomedical Research and Development Price Index (BRDPI, orange) was used to adjust for inflation using FY2014 as the base year and plotted in millions of dollars by fiscal year.
Figure 7: Mean & Median NIDDK R01 Award Costs, Competing and Non-competing (Includes Direct and Indirect Costs) from FY2014-FY2023
Accessible Image Description
Figure 7: Mean & Median Cost of R01 awards from FY2014 to FY2023. The Mean (blue) and Median (orange) cost of all R01 awarded grants was plotted in thousands of dollars by fiscal year.
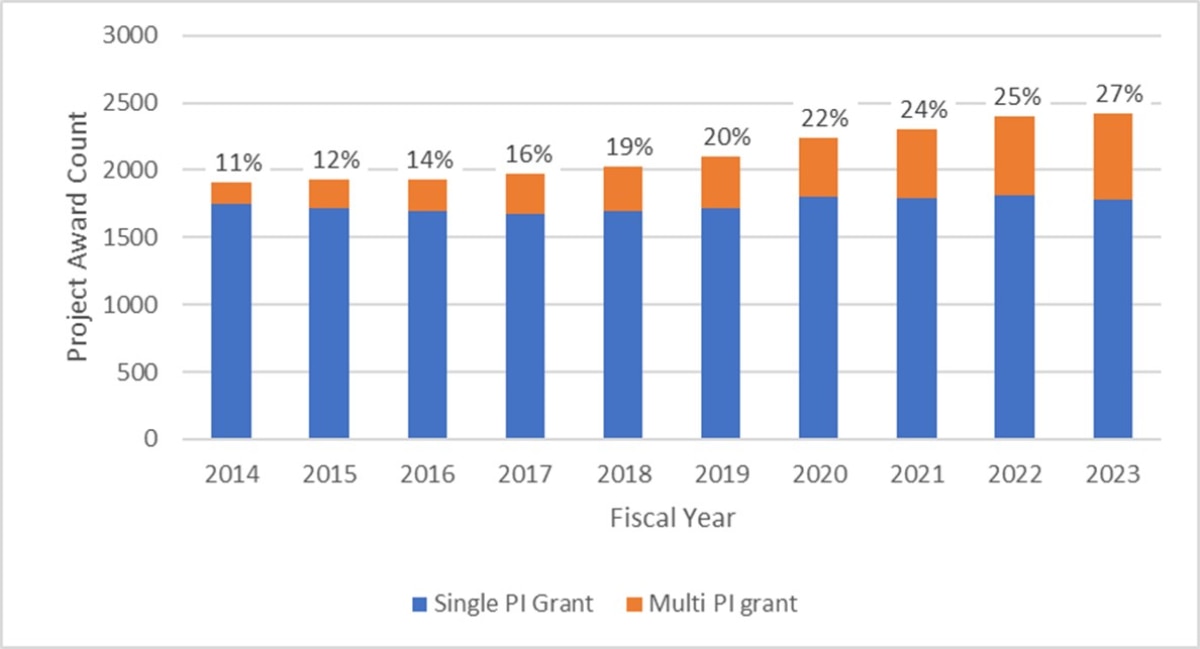
NIDDK has observed changes in the R01 research portfolio associated with multi-PI grants. The multi-PI grant provides an opportunity for a team science approach to complex research questions. Overall, the number and the proportion of multi-PI R01s supported by NIDDK has increased. In FY2014, multi-PI R01 grants comprised 11% of the total R01 portfolio. In subsequent fiscal years, the percentage of multi-PI grants has grown steadily and in FY2023 is at 27% of the NIDDK R01 portfolio (Fig. 8).
Figure 8: Single and Multi-PI (MPI) Competing and Non-competing R01 Awards from FY2014 to FY2023
Accessible Image Description
Figure 8: Single and Multi-PI R01 awards by Fiscal Year. Number of competing and non-competing Single-PI (orange) or Multi-PI (blue) R01 awards from FY2014 to FY2023. The number above each bar represents the Multi-PI R01 percentage (%) as part of the total R01 portfolio.
Core Value: Supporting Pivotal Clinical Studies and Trials
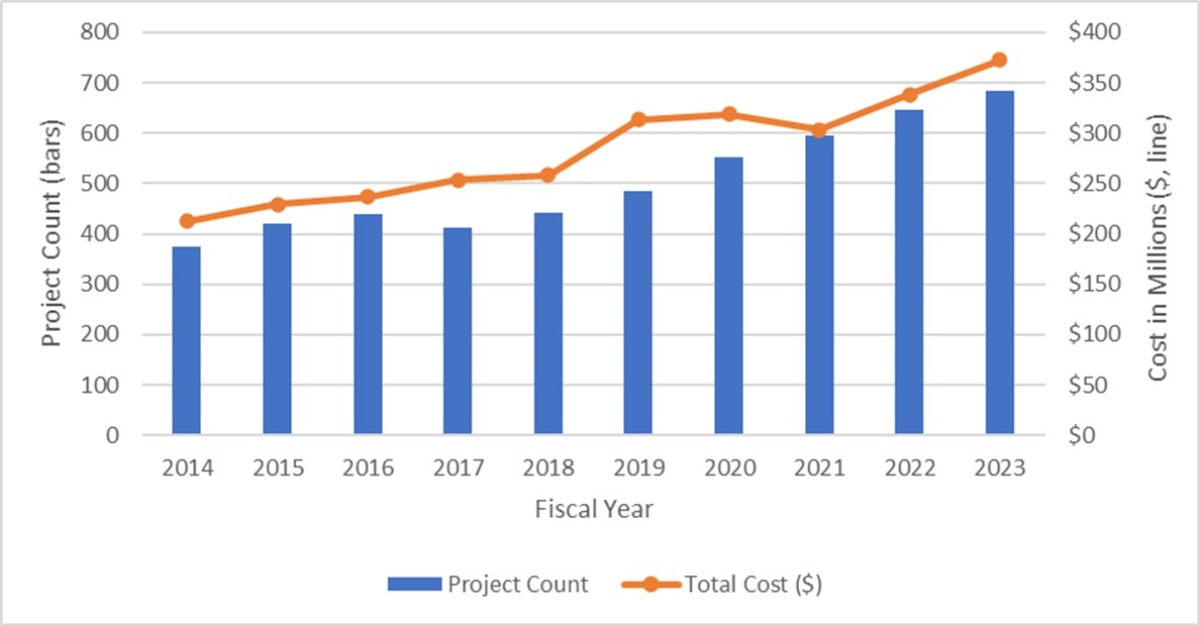
NIDDK uses various mechanisms, including grants and cooperative agreements, to support research that involves human subjects. NIH defines human subjects research as “studies on a human who is a living individual about whom research is being conducted by 1) obtaining information or biospecimens through intervention or interaction with the individual, and uses, studies, or analyzes the information or biospecimens; or 2) using, studying, analyzing, or generating identifiable private information or identifiable biospecimens.” NIDDK has a considerable portfolio of human subjects research, represented by more than 17,600 awards (number includes competing awards and continuations) and over $8.4 billion invested from FY2014 to FY2023. Figure 9A shows the increase of projects that include human subjects and the dollars invested across fiscal years. Overall, from FY2014 to FY2023, there was a 28% increase in the number of human subjects research awards and a 35% increase in spending on human subjects research across the NIDDK portfolio. As a subset of the human subjects research, awards supported using the R01 constituted almost 50% of the entire human subject research portfolio in FY2023. There were 622 R01 projects in FY2014 and 944 R01 projects in FY2023 (52% increase) that included human subjects. While numbers of R01 awards increased, costs rose proportionately more. Comparing FY2023 with FY2014, the annual support costs associated with R01 awards that included human subjects increased by 81% (Fig. 9B).
Figure 9A: NIDDK Competing and Non-competing Human Subjects Research Cost and Project Count across the entire DK Portfolio.
Accessible Image Description
Figure 9A: Project Count and Total Cost of All NIDDK-awarded Grants with Human Subjects by Fiscal Year. The NIDDK-supported project count with human subjects (blue bars) and the total cost, in millions (orange line), from FY2014 to FY2023 across all grant mechanisms/activities within the NIDDK portfolio. Grants were identified using the NIH human subjects definition.
Figure 9B: NIDDK Competing and Non-competing Human Subjects Research Cost and Project Count in the R01 Portfolio.
Accessible Image Description
Figure 9B: Project Count and Total Cost of NIDDK-awarded R01 Grants with Human Subjects by Fiscal Year. The NIDDK-supported project count with human subjects (blue bars) and the total cost, in millions (orange line), from FY2014 to FY2023 in the NIDDK R01 portfolio. Grants were identified using the NIH human subjects definition.
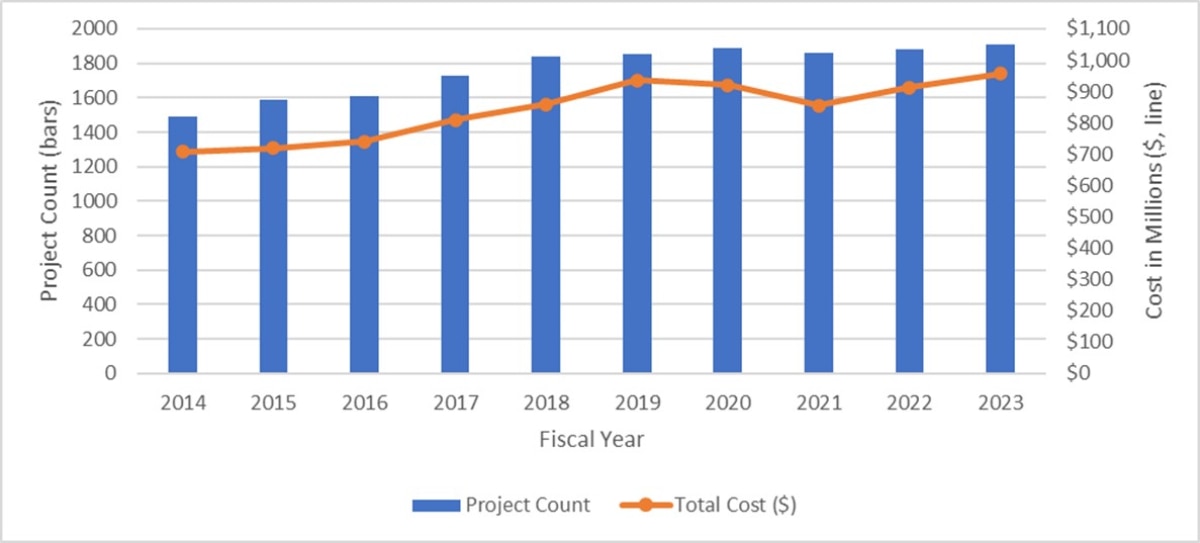
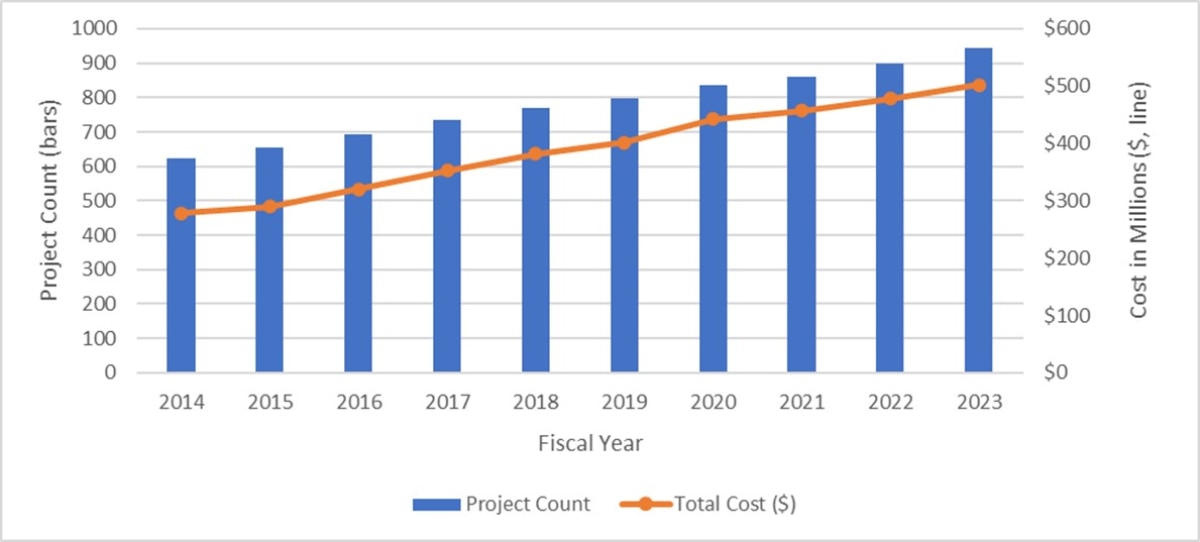
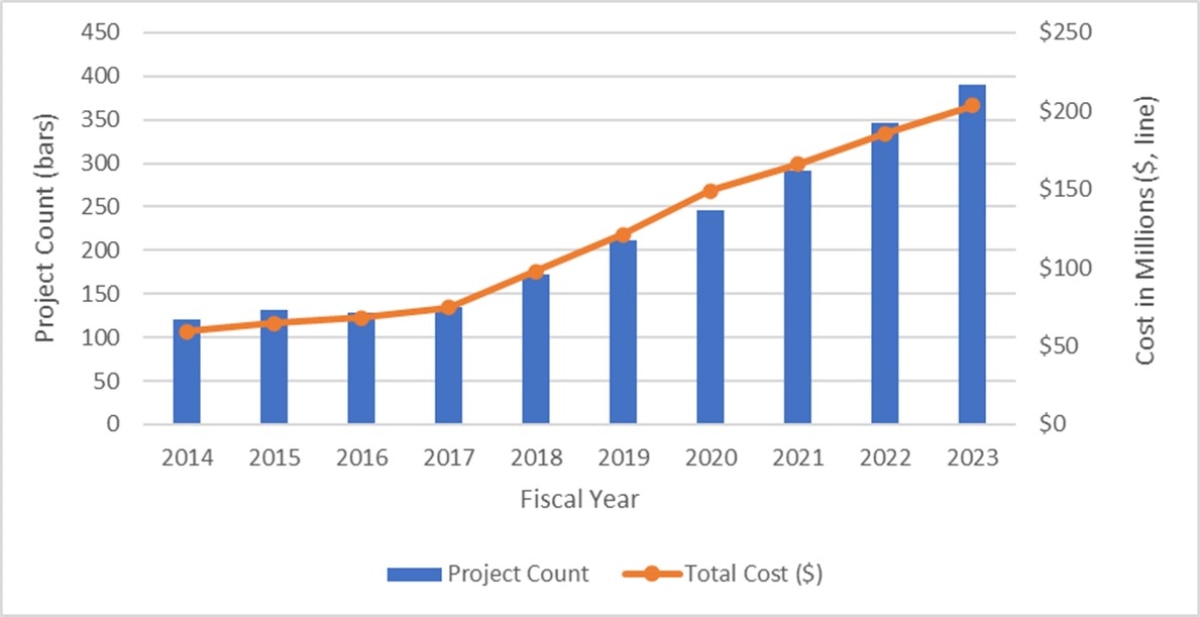
As a subset of human subjects research, NIDDK is also committed to supporting pivotal clinical trials. In 2014, NIH revised the definition of a clinical trial in anticipation of stewardship reforms to ensure a clear and responsive definition. NIH defines a clinical trial as a research study in which “one or more human subjects are prospectively assigned to one or more interventions (which may include placebo or other control) to evaluate the effects of those interventions on health-related biomedical or behavioral outcomes.” From FY2014 to FY2023, across the entire research portfolio and leveraging several different types of mechanisms/activities (e.g., R01, U01, K23, etc.), NIDDK supported more than 5,000 clinical trial awards (number includes competing awards and continuations), which represents over $2.8 billion invested over the decade. From FY2014 to FY2023, NIDDK saw an increase of 83% and 75% in project count and spending (figures include competing and continuation awards), respectively, for research involving clinical trials. (Fig. 10A). The R01 grant clinical trial portfolio expanded substantially between FY2014 and FY2023, with a 225% increase in the number of R01 clinical trial projects and a 244% increase in R01 clinical trial funding.(Fig. 10B). While it is likely that there are a number of factors associated with this growth, it should be noted that NIH launched an effort to enhance its stewardship of clinical trials in 2016 (see Building Better Clinical Trials through Stewardship and Transparency). This initiative led to a change, effective for due dates on or after January 2018 (see NOT-OD-18-106 and related announcements), where NIH required all applications involving one or more clinical trials to be submitted through a notice of funding opportunity specifically designed and designated for clinical trials. The change was implemented, in part, to improve reporting on clinical trials (see Information About Clinical Trial Stewardship). Given the growth in the clinical research portfolio overall, it is likely that several factors intersected to impact the observed change. However, the nexus of the policy implementation with the observed increase in clinical trial projects and spending does indicate that the policy change did impact categorization of clinical trials.
Figure 10A: NIDDK Competing and Non-competing Grant Count and Total Cost with Clinical Trial Research.
Accessible Image Description
Figure 10A: Project Count and Total Cost of All NIDDK-awarded Grants (competing and non-competing) with Clinical Trial Components by Fiscal Year. The NIDDK-supported project count with a clinical trial component (blue bars) and the total cost, in millions (orange line), from FY2014 to FY2023 across all grant mechanisms/activities within the NIDDK portfolio. Grants were identified using the NIH clinical trial definition.
Figure 10B: NIDDK Competing and Non-competing Human Subjects Research Cost and Project Count in the R01 Portfolio.
Accessible Image Description
Figure 10B: Project Count and Total Cost of NIDDK-awarded R01 Grants (competing and non-competing) with Clinical Trial Components by Fiscal Year. The NIDDK-supported project count with a clinical trial component (blue bars) and the total cost, in millions (orange line), from FY2014 to FY2023 in the NIDDK R01 portfolio. Grants were identified using the NIH clinical trial definition.
Core Value: Promoting a Steady and Diverse Pool of Talented New Investigators
NIDDK is keenly focused on the next generation of researchers. An Early Stage Investigator (ESI) is defined by NIH as “an investigator who has completed their terminal research degree or end of post-graduate clinical training, whichever date is later, within the past 10 years and who has not previously competed successfully for a substantial NIH independent research award.” To help these investigators gain traction in their research careers, NIDDK has established a differential payline for ESIs starting in FY2012 (Table 1). As mentioned above, ESI paylines had been five percentile points more generous than the standard NIDDK R01 payline until FY2020, when NIDDK increased its payline for ESI applications to the 25th percentile. Associated with this effort, compared to the number in FY2019, NIDDK increased the number of awards to ESIs by an average of 49% between FY2020 to 2023 (Fig. 11). It is important to note that once an ESI or NI receive their first competing award, they are no longer counted in that group for future years even within the first project period. Once they receive the first competing award, they would be classified as established investigators.
Figure 11: Number of Investigators at Various Career Stages Supported by at Least One R01 from FY2014 to FY2023
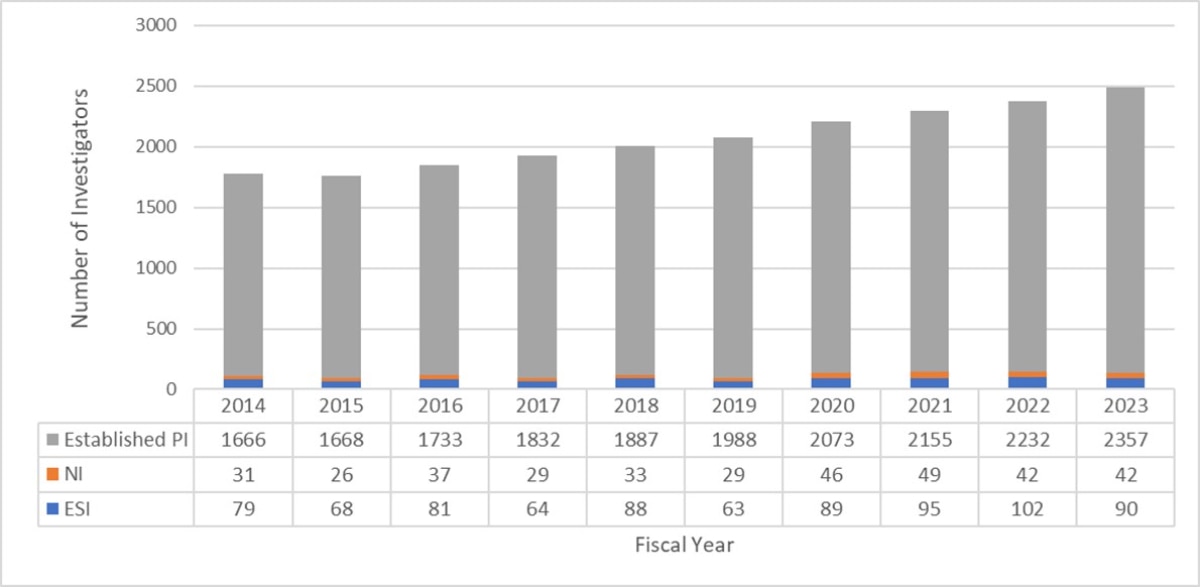
Accessible Image Description
Figure 11: Number of Principal Investigators (PIs) by Career Stage Supported by at Least One NIDDK R01 Award. Number of PIs on at least one R01 grant were reported by their respective career stage in each fiscal year. The number of Established Investigators (gray), New Investigators (NI, orange), and Early Stage Investigators (ESI, blue) are reflected in each bar. The table represents the total value of PIs included in each fiscal year. ESIs and NIs are only counted in these groupings in the year that they received their competing award and not in subsequent years of their award. Once they receive the first competing award, they would be classified as established investigators.
While there have been year-to-year fluctuations in applications and awards, NIDDK’s efforts to support the next generation of researchers are generally associated with growing numbers of ESI applications and awards over the past ten years. In FY2014, NIDDK received 319 R01 applications from ESIs and made 80 ESI awards. In FY2023, NIDDK received 398 R01 applications from ESIs, a 25% increase, and subsequently funded 89 ESI applications, an 11% increase compared to FY2014 (Fig. 12).
Figure 12: Number of NIDDK ESI R01 Applications and Awarded Grants (FY2014-FY2023)
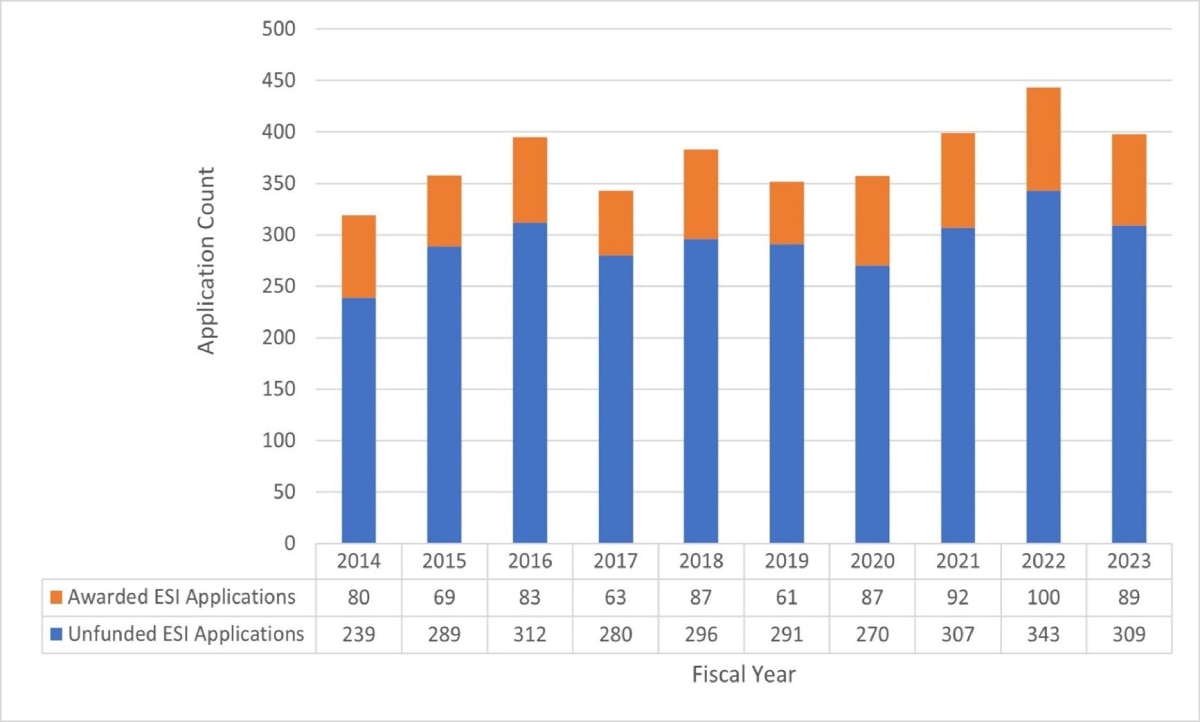
Accessible Image Description
Figure 12: NIDDK ESI R01 Applications and Awarded Grants By Fiscal Year. Stack plot shows the number of Early Stage Investigator Unfunded R01 applications (blue) and Awarded R01 awards (orange) in each fiscal year.
NIDDK’s core value of promoting a steady and diverse pool of talented new investigators extends beyond the career stage of the investigator. The Institute works to foster breadth in the composition of its investigator workforce. For example, age dynamics within the investigator workforce is an important consideration for NIDDK’s research in the future. NIH, as a whole, has noted the increase in the mean and median age of R01 funded PIs over the last several years. Within the NIDDK R01 portfolio, a similar increase of PI age exists when examining the mean and median age from 2014 to 2019 (Fig. 13). However, in FY2020, mean age of R01 PIs stabilized and then there was a small decrease in mean age of R01 PIs in FY2021 and FY2022 (Fig. 13). In addition, the median age of R01 PIs decreased from 52 to 51 years in FY2020 to FY2021 and remained at 51 years in FY2022. Compared to FY2022, in FY2023 there was an apparent increase in the mean and median age of PIs (53.5 years old and 52 years, respectively). While it is hard to know all the underpinning drivers for this apparent increase, fluctuations in the numbers of applications submitted by investigators within different groups and the merit of the applications, as assessed in peer review, contribute to fluctuations in the numbers of applications funded for different age groups and hence the mean/median age of NIDDK-supported R01 investigators overall. NIDDK is committed to promoting a diverse and talented next generation of researchers. NIDDK will continue to monitor the age of its investigator workforce, work to understand the dynamics that impact application/award rates for investigators at different career stages, and make appropriate adjustments as needed.
Figure 13: Median and Mean Ages of NIDDK R01 Investigators, from FY2014 to FY2023
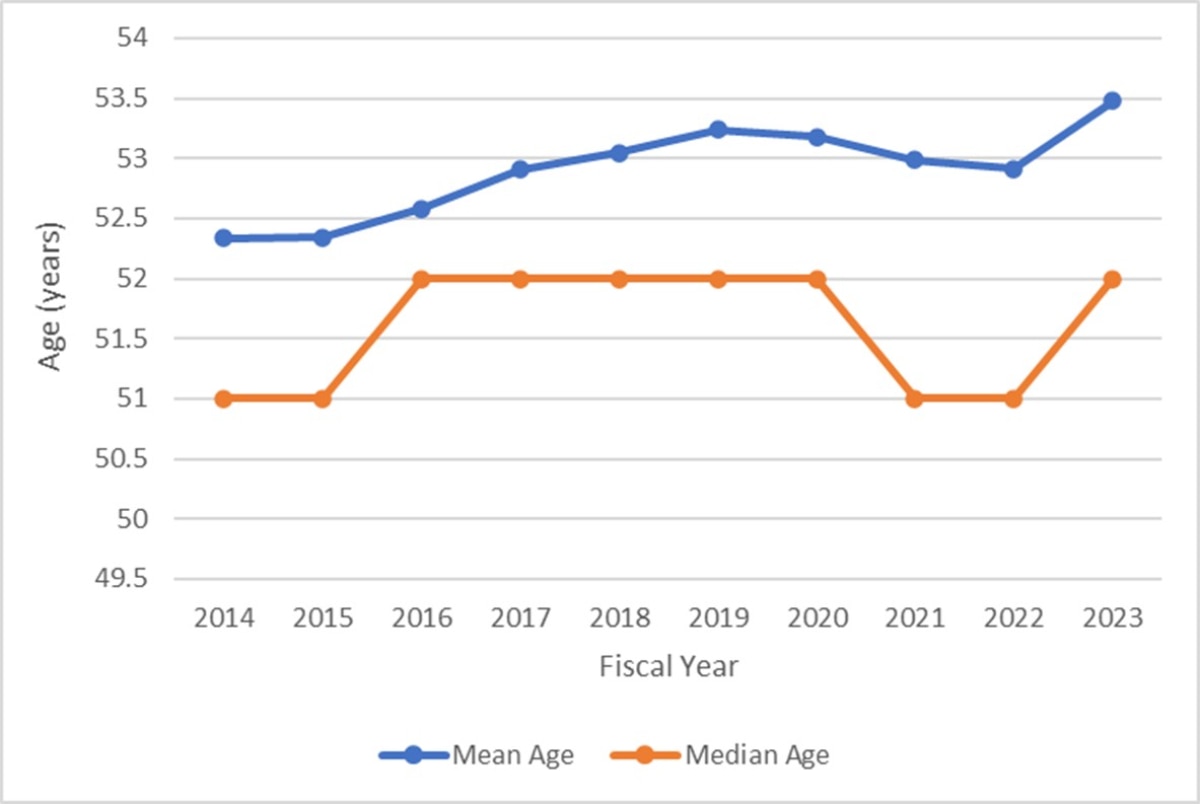
Accessible Image Description
Figure 13: Median and Mean Age of NIDDK-supported R01 PIs by Fiscal Year. The mean age (blue) and median age (orange) of R01 funded PIs from FY2014 to FY2023. Age information was provided by the NIH Office of Extramural Research and was calculated as the age of the PI at the time of the R01 application in each fiscal year.
NIH’s ability to help ensure that the nation remains a global leader in scientific discovery is dependent upon a pool of highly talented scientists from diverse backgrounds who will help to further the NIH's mission. NIH has acknowledged the significant racial gap in NIH R01 or equivalent grant funding. This has brought to light the lack of diversity among investigators conducting NIH-supported research. Collectively, NIH is working to enhance the inclusion of underrepresented groups in biomedical research. Diversity in the research workforce is important to ensure appropriate perspective and research innovation, to foster confidence and trust with the public, and promote appropriate recruitment for clinical research and clinical trials.
NIDDK reviewed the self-identified racial profile of PIs within the R01 portfolio from FY2014 to FY2023. Table 2 shows numbers of PIs, by race, who submitted an R01 application to NIDDK and who received a NIDDK R01 award. Of the 6,672 PIs who identify as White and submitted an application, 3,111 (47%) received an award. Of the 248 PIs who self-identified as Black or African-American, a total of 78 (31%) received an R01 award. Efforts within NIDDK and around the NIH have been prioritized to develop appropriate opportunities to help to enhance the diversity of NIH-supported PIs (e.g. Chief Officer for Scientific Workforce Diversity (COSWD), UNITE initiative, etc.).
Table 2: NIDDK R01 PI demographic information by race from FY2014 to FY2023
| White | Asian | Black or African-American | American Indian/Alaska Native | Native Hawaiian or Other Pacific Islander | Unknown |
Withheld | More than One Race |
|
|---|---|---|---|---|---|---|---|---|
| Funded R01 PIs | 3111 | 1157 | 78 | * * | * * | 74 | 206 | 62 |
| PIs who submitted R01 applications | 6672 | 2758 | 248 | 17 | * * | 507 | 559 | 152 |
| Success Rate | 47% | 42% | 31% | * * | * * | 15% | 37% | 41% |
Accessible Description
Table 2: NIDDK R01 PI demographic information by race from FY2014 to FY2023. Self-reported race data of NIDDK R01 applicants and awardees. The first row shows the number of funded/awarded R01 PIs by race. The second row shows the total number of PIs who submitted a R01 application by race. The success rate is the percentage of the number of funded R01 PIs divided by the number of PIs who submitted a R01 application. Self-reported race information was provided by the NIH Office of Extramural Research. NIH policy requires the redaction of data where the sample size is less than 11 for the privacy protection of the individuals. (**=actual value <11)
Core Value: Fostering exceptional research training and mentoring opportunities
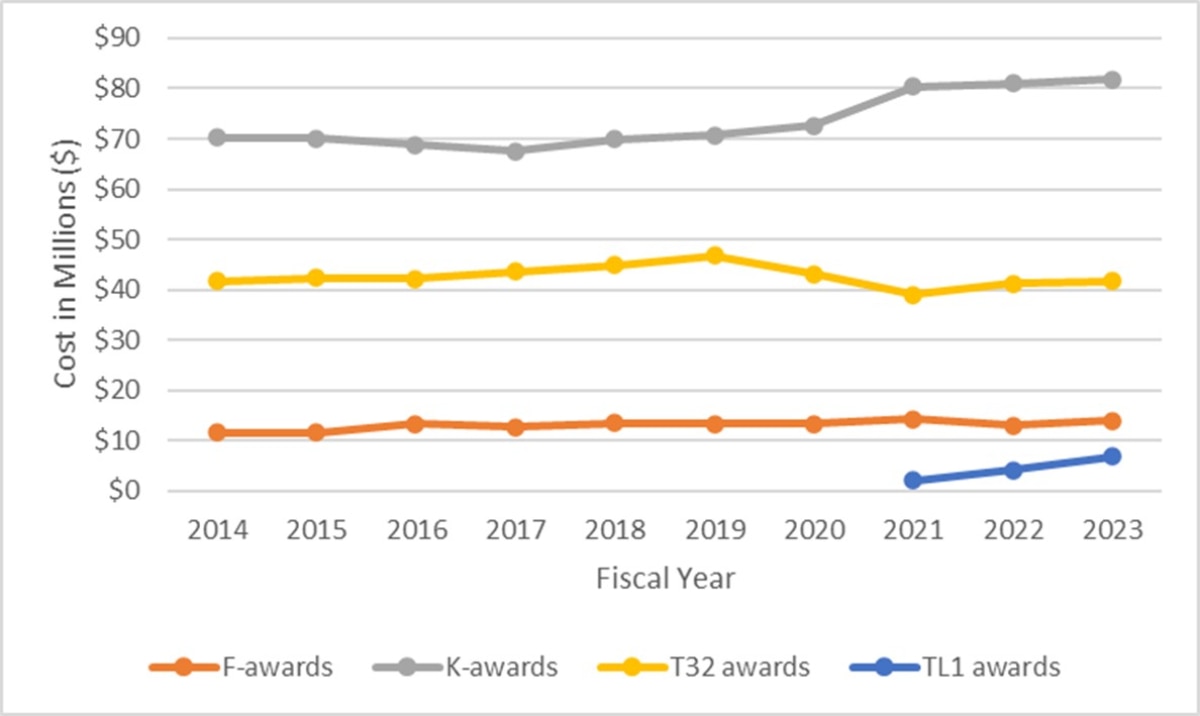
NIDDK’s commitment to training and developing the careers of the next generation of scientists remains a key priority. NIDDK leverages Fellowship (F), Career Development (K), and Training (T) awards to support a wide array of trainees, including medical and graduate students, postdoctoral fellows, and physician researchers. From FY2014 to FY2023, NIDDK has awarded more than $1.3 billion in support of trainees across various training awards. While there have been some fluctuations in the trainee cost year by year, for the F- and K-awards, there was an overall increase of 20% and 17%, respectively, and no significant change in the T32 awards in total cost support from FY2014 to FY2023. A recent development for NIDDK is the introduction of the TL1 award, which is now being leveraged by the Division of Kidney, Urologic and Hematologic Diseases (KUH) in lieu of the T32 award. The first TL1 awards were made in FY2021. In FY2023, support of TL1 awards totaled nearly $7M (Fig. 14).
Figure 14: NIDDK-supported Competing and Non-competing Training Award Total Costs of Select Mechanisms (Includes Direct and Indirect Costs) from FY2014-FY2023
Accessible Image Description
Figure 14: NIDDK-supported Training Award Total Costs. NIDDK total cost, in millions, of Fellowships (F), Career Development (K), and Training (T) mechanisms from FY2014-FY2023. The F-awards (orange) include activity codes: F30, F31, and F32. The K-awards (gray) include activity codes: K01, K08, K23, K24, and K99. The T32 awards are shown in yellow and the TL1 awards are shown in blue. Total cost includes direct and indirect costs of all awards in each fiscal year.
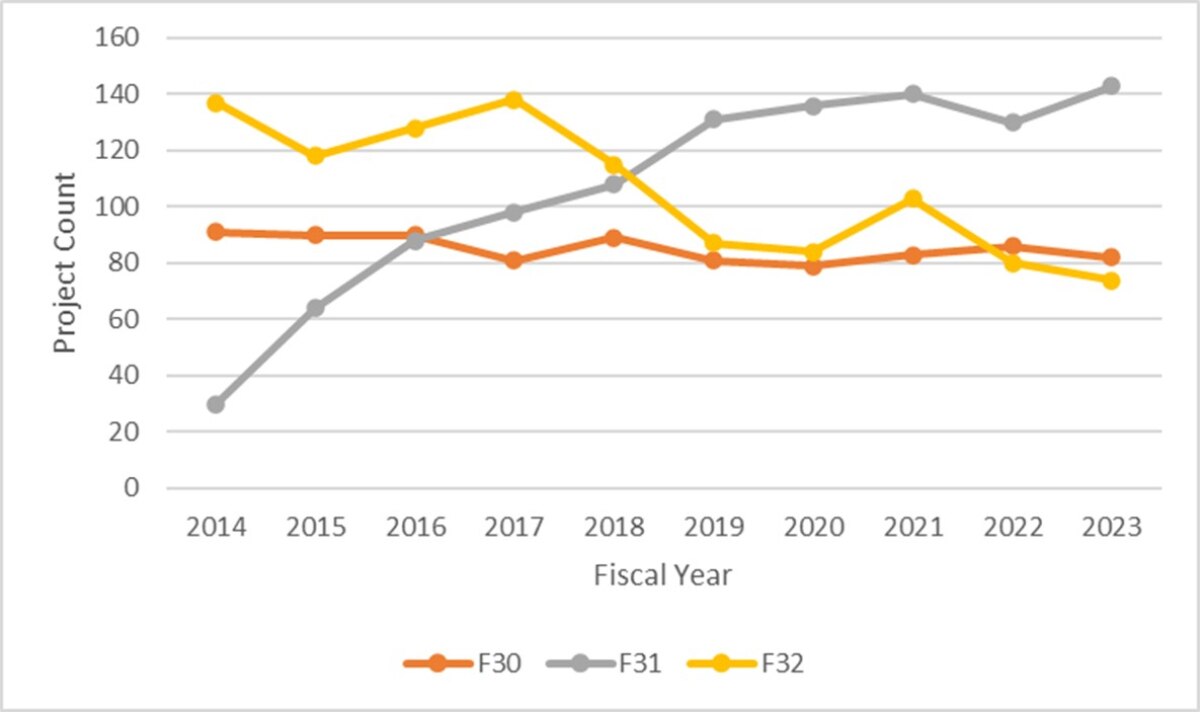
From FY2014 to FY2023, NIDDK supported approximately 8,900 trainees/fellows across the F-, K-, and T-award mechanisms. For the F-awards, there have been some changing dynamics in the numbers across the fiscal years. For example, the F30, a predoctoral fellowship for M.D./Ph.D. trainees, has decreased from 91 awards in FY2014 to 82 awards in FY2023 (10% decrease). Similarly, F32 postdoctoral fellowship awards decreased from 137 to 74 (46% decrease) from FY2014 to FY2023. Of note, the F31, the predoctoral Ph.D. fellowship, saw a 477% increase in funded awards from 30 awards in FY2014 to 143 awards in FY2023 (Fig. 15). The increase in the F31 awards was the direct result of NIDDK participating in a NIH-wide F31 funding announcement starting in 2014.
Figure 15: Number of NIDDK-supported Competing and Non-competing Fellowship (F) Awards by Activity Code from FY2014-FY2023
Accessible Image Description
Figure 15: NIDDK-supported Fellowship (F) Awards by Activity Code by fiscal year. The total project count of funded F30 (orange), F31 (gray) and F32 (yellow) awards from FY2014 to FY2023.
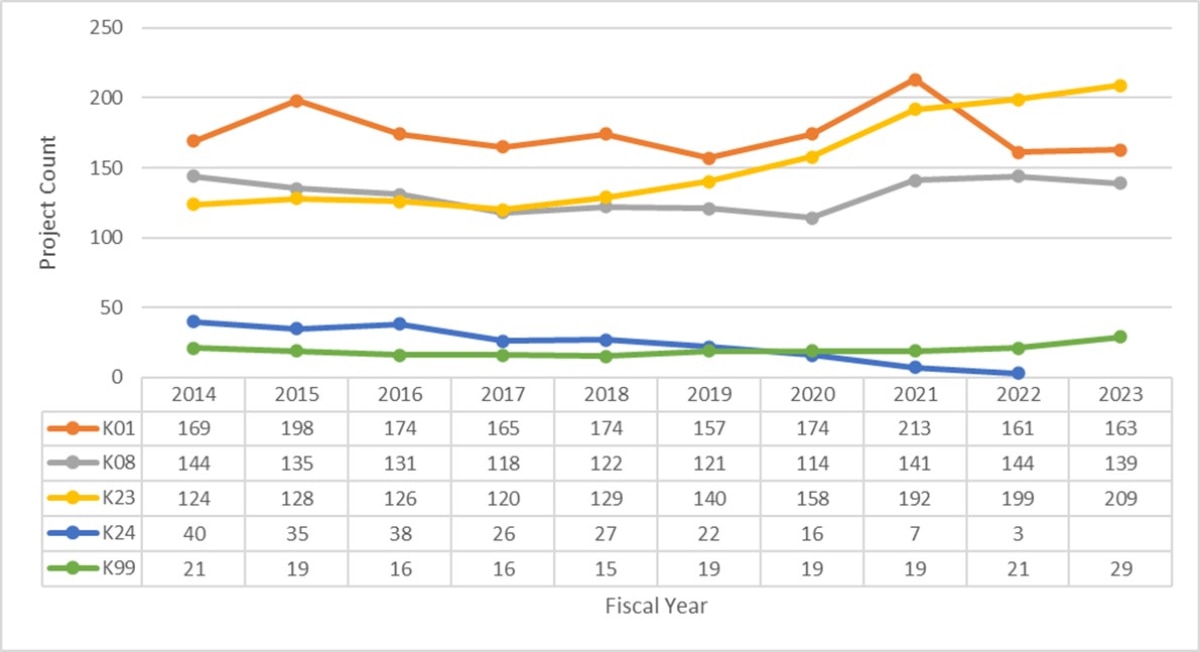
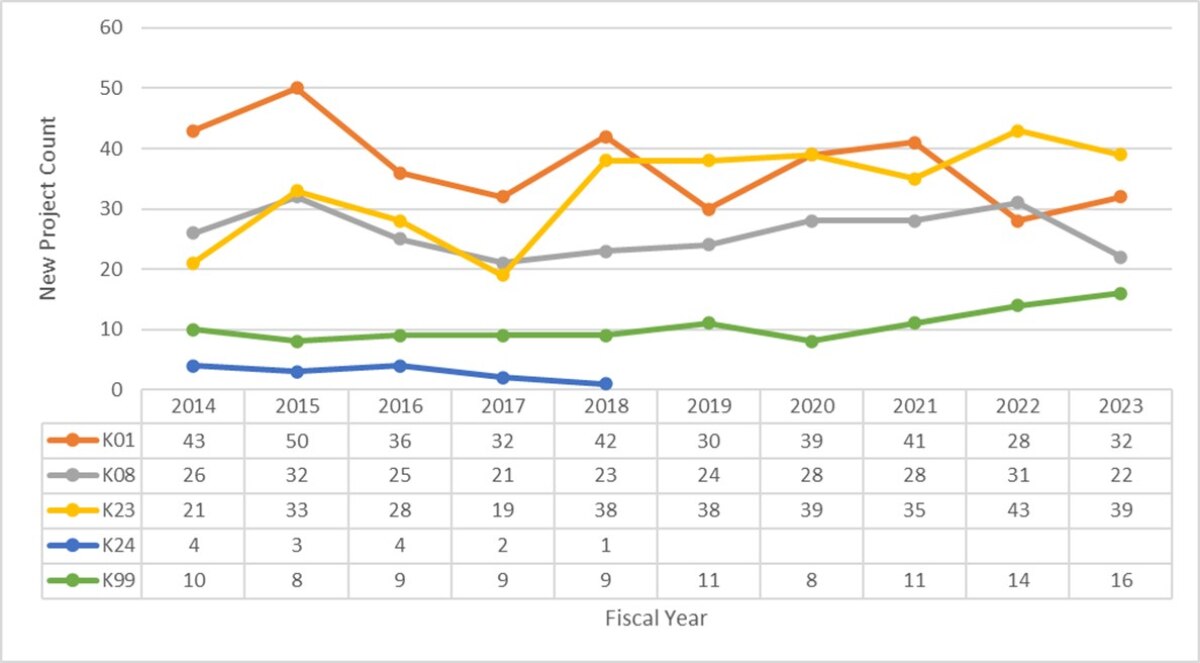
The NIDDK career development (K) portfolio was also somewhat dynamic. While there were some changes in each of the fiscal years in numbers of awards made, the research scientist development award (K01) averaged approximately 173 awards and the career transition award (K99) remained relatively constant with an average of 19 awards from FY2014 to FY2023. The clinical investigator award (K08) had been decreasing from FY2014 to FY2020. Because of the impact of COVID, NIDDK extended the support year for some of the existing K08 grants, which accounts for the uptick in the project count from FY2021 to FY2023. For the mentored patient-oriented research career development award (K23), there was a net increase of 69% with 124 awards in FY2014 increasing to 209 awards in FY2023. The number of midcareer investigator awards in patient-oriented research grants (K24) has steadily declined, in part reflecting NIDDK’s decision to cease making new awards after 2018. (Fig. 16A) When specifically examining the contribution of new competing K-awards, fluctuations in the project count have occurred from FY2014 to FY2023 (Fig. 16B)
Figure 16A: Number of NIDDK-supported Competing and Non-competing Career Development (K) Awards by Activity Code from FY2014-FY2023
Accessible Image Description
Figure 16A: NIDDK-supported Career Development (K) Awards by Activity Code by Fiscal Year. The total project count of funded K01 (orange), K08 (gray), K23 (yellow), K24 (blue), and K99 (green) awards from FY2014 to FY2023.
Figure 16B: Number of New (Type 1) NIDDK-supported Competing Career Development (K) Awards by Activity Code from FY2014-FY2023
Accessible Image Description
Figure 16B: New (Type 1) NIDDK-supported Career Development (K) Awards by Activity Code by Fiscal Year. The total project count of funded K01 (orange), K08 (gray), K23 (yellow), K24 (blue), and K99 (green) awards from FY2014 to FY2023.
The NIDDK T32 portfolio has also changed over the course of the decade. From FY2014 to FY2022, there was a 20% decrease in the number of trainees on T32 grants and a 21% decrease in the number of T32 projects in that same time (Fig. 17). It should be noted that one of the programmatic divisions is piloting the use of a different mechanism to support training of future researchers in lieu of the T32. Specifically, the Division of Kidney, Urologic and Hematologic Diseases (KUH) began accepting applications for Institutional Network Awards for Promoting Kidney, Urologic, and Hematologic Research Training (TL1) in FY2020. There were four TL1 fellowship awards made in FY2021 and 28 trainees were supported by those awards. In FY2022, there were another three TL1 awards made, bringing the total of new and continuing TL1 awards to seven with a total of 53 trainees supported by the program. In FY2023, total number of new and continuing TL1 awards was nine with 52 trainees supported (Table 3).
Figure 17: Number of NIDDK-supported T32 Trainees and Project Count from FY2014-FY2022
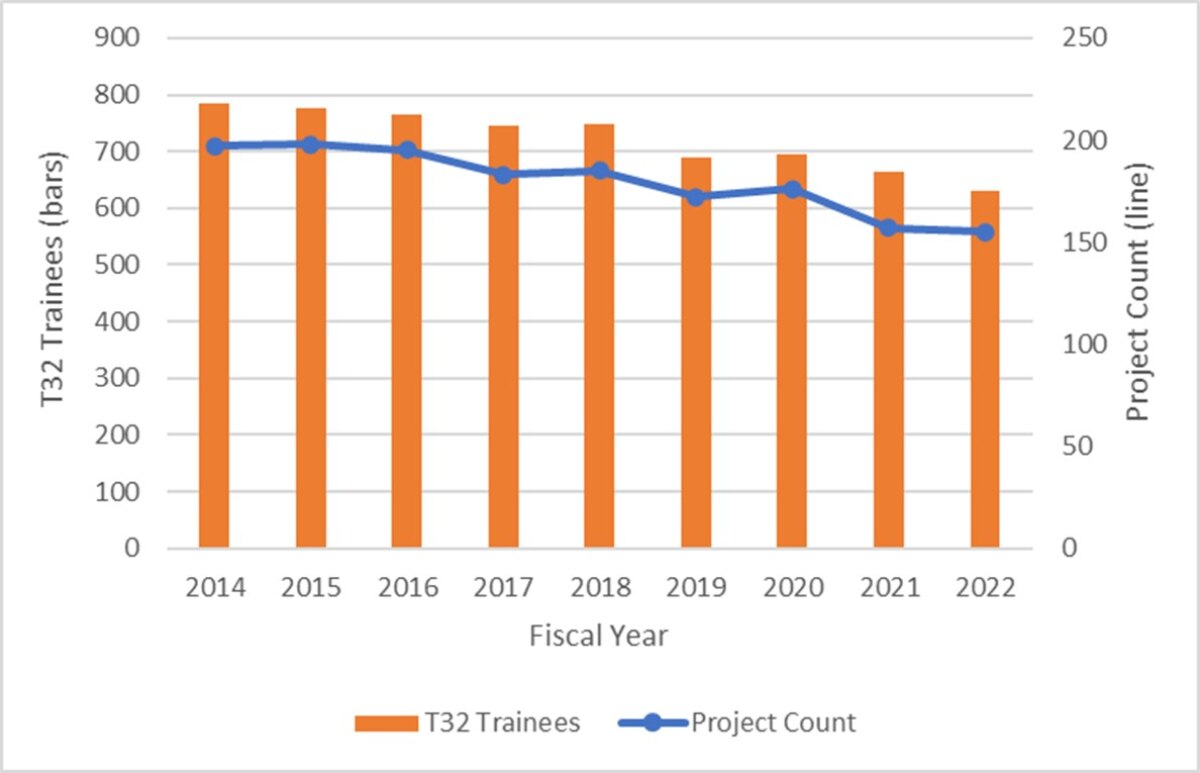
Accessible Image Description
Figure 17: NIDDK T32 Trainee and Project Count from FY2014-FY2022. The total number of T32 Trainees (orange bars) on NIDDK-supported T32 grants (blue line) from FY2014 to FY2022. Note: FY2023 data was not available at the time of the generation of this chart because T32 awards made in FY2023 continue into FY2024. The total number of T32 trainees is reported at the end of the award period; therefore, FY2023 data will not be available until later in FY2024.
Table 3: Number of NIDDK-supported TL1 Trainees and Project Count from FY2021-FY2023
| Fiscal Year | Number of Trainees | Project Count |
|---|---|---|
| 2021 | 28 | 4 |
| 2022 | 53 | 7 |
| 2023 | 52 | 9 |
Accessible Description
Table 3: NIDDK TL1 Trainee and Project Count from FY2021-FY2023. The total number of TL1 Trainees on NIDDK-supported TL1 grants (project count) from FY2021 to FY2023