


Chapter 1: All Digestive Diseases
James E. Everhart, M.D., M.P.H.
For systematic coding, mortality and health care statistics rely on disease classification systems, of which the International Classification of Diseases (ICD) is the world standard. The diagnostic codes traditionally used for digestive diseases primarily code for chronic conditions that are neither infectious nor malignant. In the current ICD edition (ICD-10), these include K20 through K93 in chapter “K” (Appendix 1). Other digestive diseases of public health significance and of particular interest to practitioners and researchers are coded in other chapters: Intestinal Infectious and Parasitic Diseases (A00–A09); Viral Hepatitis (B15–B19); Malignant Neoplasms of Digestive Organs (C15–C26); Hemorrhoids (I84); Esophageal and Gastric Varices (I85, I86.4); Maternal Disorders (Digestive) Related to Pregnancy (O21–O22); Conditions (Digestive) Originating in the Perinatal Period (P53, P54, P57, and P59); Digestive System Disorders of Fetus and Newborn (P75–P78, P92); and Congenital Malformations, Deformations, and Chromosomal Abnormalities (Q39–Q45). For some of these groups of conditions, there were enough national data for individual sections in this report. For others, they and many other digestive system disorders were grouped under "other digestive diseases," so that a more complete impact of the total burden of digestive diseases could be estimated.
ICD-9 codes were used for mortality 1979–1998, and ICD-10 codes have been used subsequently, which has been noted on figures of mortality trends. As of the publication of this report, the United States had yet to switch from ICD-9-CM (Clinical Modification) to ICD-10 codes for coding morbidity, despite the publication of the newer edition in 1992. Therefore, all morbidity information from 1979 through 2005 was from ICD‑9-CM.
In 2004, there were an estimated 72 million ambulatory care visits with a first-listed diagnosis of a digestive disease and more than 104 million visits with an all-listed diagnoses, which equated to a rate of 35,684 visits per 100,000 U.S. population (Table 1). In other words, for every 100 U.S. residents, there were 35 ambulatory care visits at which a digestive disease diagnosis was noted. Visits were common for all age groups, with the highest rate among persons age 65 years and older. Age-adjusted rates were comparable for blacks and whites and were 20 percent higher for females than for males.
Digestive diseases were common all-listed diagnoses at hospital discharge in 2004 as well as first-listed diagnosis (Table 1). There were approximately 4.6 million discharges of patients with digestive disease as first-listed diagnosis and 13.5 million discharges as all-listed diagnoses. With a rate of all-listed diagnoses of 4,608 per 100,000, there were nearly five overnight hospital stays per 100 U.S. residents that included a discharge diagnosis of at least one digestive disease. These rates were nearly as high among children as among middle-aged adults and were higher in these two age groups than among younger adults. The highest rate was among persons age 65 years and older. In contrast to their ambulatory care visits, blacks had higher rates of hospitalization than did whites. Comparable or lower age-adjusted rates of ambulatory care visits among blacks, yet higher rates of hospitalization, were a common finding for a number of digestive diseases. Women had a 10 percent higher age-adjusted rate than men.
The rate of ambulatory care visits over time (age-adjusted to the 2000 U.S. population) is shown in Figure 1 by 3-year periods (except for the first period, which is 2 years), between 1992 and 2005 (beginning with 1992–1993 and ending with 2003–2005). Age-adjusted rates increased during this period by one-third, from 26.4 per 100 population to 35.3 per 100 population. This trend in increased rates of ambulatory care visits started at least as early as 1985, when there were 22.4 digestive disease diagnoses per 100 population.3 Rates of all-listed hospitalization with a digestive disease diagnosis fell between 1983 and 1988, a pattern that occurred for all hospitalizations in the United States. Hospitalization rates were stable for the next 10 years before rising to a rate in 2004 equal to the previous peak rate in 1982. The age-adjusted percent increase between 1998 and 2004 was 35 percent. This overall increase was the net of diagnoses whose rates increased and diagnoses whose rates decreased. The largest contributor to the increase was “other digestive diseases”—those conditions that do not have separate chapters in this report. The largest individual disease contributions to the increase were made by gastroesophageal reflux disease (GERD), with an increase over this period of 376 per 100,000 population; viral hepatitis C, with 79 per 100,000; chronic constipation, with 62 per 100,000; intestinal infections, with 41 per 100,000; and pancreatitis, with 23 per 100,000. Except for pancreatitis, each of these diagnoses was more likely to be listed as a secondary discharge diagnosis than as the first-listed diagnosis.
The recent increase in overnight hospital stays with a diagnosis of digestive disease is surprising for two reasons. A few common conditions were known to have declined as reasons for overnight hospitalizations, notably peptic ulcer disease (due to decreased frequency) and gallstones (due to shift to same-day surgery). Of greater significance was the modest rate of increase of hospital discharges for all diseases (from 11,569 per 100,000 in 1998 to 13,104 per 100,000 in 2004, a 13.3 percent increase) relative to the larger increase for digestive diseases. In 1998, 25.3 percent of all hospital discharges had a diagnosis of digestive diseases; this increased to 30.1 percent in 2004. Thus, rates of hospitalizations with digestive disease diagnoses increased both absolutely and as a proportion of all hospitalizations.
In 2004, there were more than 236,000 deaths in the United States with a digestive disease as the underlying cause (Table 2), which represented 9.8 percent of all deaths. A disproportionately lower proportion of deaths from digestive diseases occurred among children (4.1 percent) and a higher proportion occurred among middle-aged adults (15.1 percent). There was no major variation in the distribution of deaths from digestive disease as a proportion of all deaths by race or sex. However, blacks had a 29 percent higher death rate than whites, and men had a 53 percent higher rate than women.
There were 2 million years of potential life lost (YPLL) prior to age 75 years due to digestive diseases, representing 8.5 years per death with digestive disease as an underlying cause. Digestive diseases were more frequently listed as underlying cause than as contributing cause, mainly due to the large effect of deaths from cancer, which was usually listed as underlying cause. There was a gradual decline in digestive disease mortality between 1979 and 2004, both as underlying (18.2 percent) and as underlying or other cause (20.3 percent) (Figure 2). There have been many contributions to this decline, but the greatest determinant was the decrease in digestive disease cancer mortality by 19.8 percent as underlying cause and 24.0 percent as underlying or other cause.
The 10 costliest prescription drugs from retail pharmacies for digestive diseases, according to the 2004 Verispan database (Appendix 2), are shown in Table 3. Dominating the prescription market at 50.7 percent of total number of prescriptions and 77.3 percent of total cost were five proton pump inhibitors, which were mainly prescribed for GERD. The other costliest medications were mesalamine (for inflammatory bowel disease), ranitidine (another anti-acid agent), tegaserod [for irritable bowel syndrome (IBS) and constipation], and ribavirin and peginterferon alfa_2a (for hepatitis C). A deficiency of the drug data is lack of information on nonprescription medications, complementary and alternative medications, infusions, and drugs administered in the hospital.
Summary data for individual digestive diseases are shown in Table 4, ordered by underlying cause of death and type of disease. Five diseases each caused more than 10,000 deaths. These were liver disease and four cancers, led by colorectal cancer. Two common causes of death were transmissible infectious diseases: gastrointestinal (GI) infections and viral hepatitis C. Chronic viral hepatitis is also believed to be a significant contributor to liver and bile duct cancers, which accounted for more than 11,000 deaths.
The YPLL prior to age 75 years is the addition of the number of years prior to age 75 at which deaths occur.
A death at age 55 years, for example, contributes 20 YPLL, while a death at age 75 years contributes none. Malignancies were responsible for 6 of the top 10 digestive diseases that contributed the most to YPLL (Table 4). Liver disease was the second leading cause of death (after colorectal cancer), but contributed the greatest number of YPLL. Also among the 10 leading causes of YPLL were hepatitis C and pancreatitis.
The distribution of burden of medical care for digestive diseases is notably different from mortality from digestive diseases. The six leading diseases with diagnosis noted at ambulatory care visits were GERD, chronic constipation, abdominal wall hernia, hemorrhoids, diverticular disease, and IBS. At least three of these (GERD, constipation, and IBS) are largely caused by disordered function of the GI tract, and diverticular disease also may be in part a consequence of dysfunction. The six most common digestive diseases diagnoses on hospital discharge records were GERD, diverticular disease, liver disease, constipation, gallstones, and peptic ulcer disease. The main difference between the records for hospital discharge diagnoses and ambulatory care diagnoses was the high numbers of diagnoses with liver disease and peptic ulcer disease, which can be life-threatening, and gallstones, which are a common reason for surgery. Because GERD and constipation should rarely lead to hospitalization, it must be assumed that when listed on discharge, they either contributed to the reason for hospitalization or were listed in thousands of discharges simply because they were so common.
References
Table 1. All Digestive Diseases: Number and Age-Adjusted Rates of Ambulatory Care Visits and Hospital Discharges With First-Listed and All-Listed Diagnoses by Age, Race, and Sex in the United States, 2004
| Demographic Characteristics | Ambulatory Care Visits First-Listed Diagnosis Number in Thousands | Ambulatory Care Visits First-Listed Diagnosis Rate per 100,000 | Ambulatory Care Visits All-Listed Diagnosis Number in Thousands | Ambulatory Care Visits All-Listed Diagnosis Rate per 100,000 | Hospital Discharges First-Listed Diagnosis Number in Thousands | Hospital Discharges First-Listed Diagnosis Rate per 100,000 | Hospital Discharges All-Listed Diagnosis Number in Thousands | Hospital Discharges All-Listed Diagnosis Rate per 100,000 |
|---|---|---|---|---|---|---|---|---|
| AGE (Years) Under 15 |
10,951 | 18,010 | 15,170 | 24,948 | 331 | 544 | 2,321 | 3,817 |
| AGE (Years) 15–44 |
21,348 | 16,967 | 28,749 | 22,848 | 1,112 | 884 | 2,401 | 1,908 |
| AGE (Years) 45–64 |
21,430 | 30,314 | 32,434 | 45,880 | 1,362 | 1,926 | 3,489 | 4,935 |
| AGE (Years) 65+ |
18,342 | 50,483 | 28,437 | 78,268 | 1,779 | 4,897 | 5,313 | 14,622 |
| Race White |
59,506 | 24,317 | 85,798 | 34,953 | 3,526 | 1,412 | 10,242 | 4,108 |
| Race Black |
8,733 | 24,076 | 13,339 | 37,784 | 531 | 1,655 | 1,702 | 5,142 |
| Sex Female |
39,531 | 25,827 | 59,553 | 38,648 | 2,545 | 1,592 | 7,593 | 4,753 |
| Sex Male |
32,540 | 23,017 | 45,236 | 32,159 | 2,023 | 1,483 | 5,909 | 4,335 |
| Total | 72,071 | 24,543 | 104,790 | 35,684 | 4,591 | 1,563 | 13,533 | 4,608 |
Figure 1. All Digestive Diseases: Age-Adjusted Rates of Ambulatory Care Visits and Hospital Discharges With All–Listed Diagnoses in the United States, 1979–2004
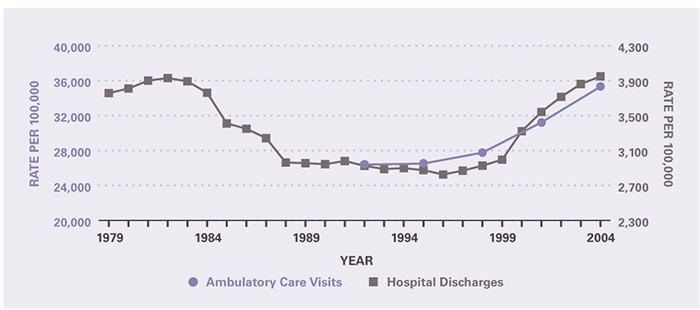
Table 2. All Digestive Diseases: Number and Age-Adjusted Rates of Deaths, Years of Potential Life Lost (to Age 75), and Digestive Disease as a Percentage of All Deaths by Age, Race, and Sex in the United States, 2004
| Demographic Characteristics | Underlying Cause Number of Deaths | Underlying Cause Rate per 100,000 | Underlying Cause Years of Potential Life Lost in Thousands | Underlying Cause Digestive Disease As Percent of All Death | Underlying or Other Cause Number of Deaths | Underlying or Other Cause Rate per 100,000 |
|---|---|---|---|---|---|---|
| AGE (Years) Under 15 |
1,612 | 2.7 | 118.2 | 4.1 | 2,908 | 4.8 |
| AGE (Years) 15–44 |
11,036 | 8.8 | 397.3 | 6.9 | 17,915 | 14.2 |
| AGE (Years) 45–64 |
66,806 | 94.5 | 1,263.8 | 15.1 | 92,862 | 131.4 |
| AGE (Years) 65+ |
156,706 | 431.3 | 228.2 | 8.9 | 252,709 | 695.5 |
| Race White |
200,834 | 77.0 | 1,579.4 | 9.8 | 313,055 | 119.7 |
| Race Black |
27,812 | 99.5 | 340.2 | 9.7 | 42,514 | 152.7 |
| Sex Female |
111,264 | 63.6 | 723.3 | 9.2 | 177,811 | 100.7 |
| Sex Male |
124,900 | 97.1 | 1,284.2 | 10.6 | 188,596 | 149.1 |
| Total | 236,164 | 80.4 | 2,007.5 | 9.8 | 366,407 | 124.8 |
Figure 2. All Digestive Diseases: Age-Adjusted Rates of Death in the United States, 1979–2004
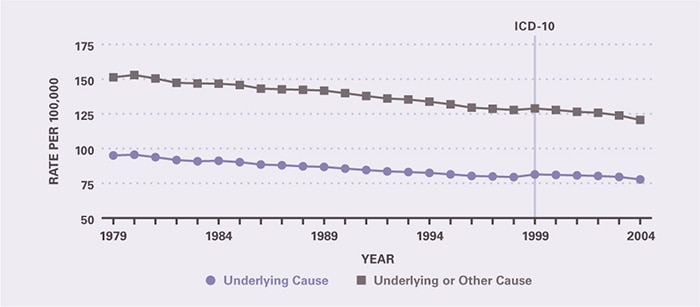
Table 3. All Digestive Diseases: Costliest Prescriptions
| DRUG | Prescription (#) | Prescription | Retail Cost | Cost |
|---|---|---|---|---|
| Lansoprazole | 20,989,993 | 15.5% | $3,104,963,208 | 25.2% |
| Esomeprazole | 19,458,740 | 14.3 | 2,845,665,944 | 23.1 |
| Pantoprazole | 11,716,033 | 8.6 | 1,408,222,345 | 11.4 |
| Rabeprazole | 8,019,431 | 5.9 | 1,135,819,908 | 9.2 |
| Omeprazole | 8,582,644 | 6.3 | 1,038,622,087 | 8.4 |
| Mesalamine | 2,448,971 | 1.8 | 468,426,719 | 3.8 |
| Ranitidine | 13,171,338 | 9.7 | 319,418,374 | 2.6 |
| Tegaserod | 1,618,699 | 1.2 | 238,030,688 | 1.9 |
| Ribavirin | 221,035 | 0.2 | 229,351,616 | 1.9 |
| Peginterferon alfa-2a | 131,001 | 0.1 | 191,754,177 | 1.6 |
| Other | 49,378,593 | 36.4 | 1,351,443,116 | 11.0 |
| Total | 135,736,478 | 100.0% | $12,331,718,182 | 100.0% |
Table 4. Burden of Selected Digestive Diseases in the United States, 2004
| DIGESTIVE DISEASE | Deaths, Underlying Causea | Years of Potential Life Lost to Age 75 Yearsa | Ambulatory Care Visits, All-Listed Diagnosisb | Hospital Discharges, All-Listed Diagnosisc |
|---|---|---|---|---|
| All Digestive Disease | 236,164 | 2,007,500 | 104,790,000 | 13,533,000 |
| All Digestive Cancer | 135,107 | 945,200 | 4,198,000 | 726,000 |
| Colorectal Cancer | 53,226 | 333,000 | 2,589,000 | 255,000 |
| Pancreatic Cancer | 31,800 | 206,800 | 415,000 | 68,000 |
| Esophageal Cancer | 13,667 | 113,800 | 372,000 | 44,000 |
| Gastric Cancer | 11,253 | 84,200 | 141,000 | 31,000 |
| Primary Liver Cancer | 6,323 | 72,400 | 63,000 | 33,000 |
| Bile Duct Cancer | 4,954 | 32,900 | — | 17,000 |
| Gallbladder Cancer | 1,939 | 10,900 | — | 6,000 |
| Cancer of the Small Intestine | 1,115 | 9,300 | — | 9,000 |
| Liver Disease | 36,090 | 559,100 | 2,398,000 | 759,000 |
| All Viral Hepatitis | 5,393 | 101,800 | 3,510,000 | 475,000 |
| Hepatitis C | 4,595 | 87,500 | 2,747,000 | 419,000 |
| Hepatitis B | 645 | 11,800 | 729,000 | 69,000 |
| Hepatitis A | 58 | 800 | — | 10,000 |
| Gastrointestinal Infections | 4,396 | 12,800 | 2,365,000 | 450,000 |
| Peptic Ulcer Disease | 3,692 | 19,700 | 1,473,000 | 489,000 |
| Pancreatitis | 3,480 | 42,800 | 881,000 | 454,000 |
| Diverticular Disease | 3,372 | 8,600 | 3,269,000 | 815,000 |
| Abdominal Wall Hernia | 1,172 | 6,900 | 4,787,000 | 372,000 |
| Gastroesophageal Reflux Disease | 1,150 | 6,000 | 18,342,000 | 3,189,000 |
| Gallstones | 1,092 | 4,400 | 1,836,000 | 622,000 |
| All Inflammatory Bowel Disease | 933 | 9,100 | 1,892,000 | 221,000 |
| Crohn’s Disease | 622 | 7,000 | 1,176,000 | 141,000 |
| Ulcerative Colitis | 311 | 2,000 | 716,000 | 82,000 |
| Appendicitis | 453 | 5,000 | 782,000 | 325,000 |
| All Functional Intestinal Disorders | 423 | 2,500 | 11,648,000 | 1,241,000 |
| Chronic Constipation | 137 | 900 | 6,306,000 | 700,000 |
| Irritable Bowel Syndrome | 20 | 0 | 3,054,000 | 212,000 |
| Hemorrhoids | 14 | 200 | 3,275,000 | 306,000 |