


Chapter 9: Primary Liver Cancer
James E. Everhart, M.D., M.P.H.
The major malignant neoplasm of the liver is liver cell cancer (hepatocellular carcinoma). Also included in this category in this report are the rare malignancies of hepatoblastoma and angiosarcoma as well as other primary specified and unspecified liver carcinomas. Intrahepatic bile duct carcinoma is included among bile duct cancers (see Appendix 1 for ICD codes).
In 2004, primary liver cancer occurred at an earlier age than any other digestive system cancer, with 50 percent of cases being diagnosed under the age of 65 years (Table 1). Hepatoblastoma, although the most common liver neoplasm among children, had minimal influence on this association because of its rarity. Incidence was lowest among non-Hispanic whites, intermediate among non-Hispanic blacks and Hispanics, and highest among Asians and American Indians. Males had more than 3 times the age-adjusted incidence of females.
The incidence of primary liver cancer rose modestly between 1979 and 1988 (14.5 percent) and more rapidly subsequently (90 percent over the period 1988–2004) (Figure 1). Liver cancer was one of the most lethal digestive system cancers, although 5-year survival did increase nearly fourfold during this period, albeit to only 8 percent.
Medical care visits and hospitalizations for liver cancer were too infrequent in 2004 to make firm statements about them. Hospitalization discharge rates (Table 2) had a demographic pattern similar to incidence rates (Table 1), with the highest rates among patients age 65 years and older, blacks, and males. Hospitalization rates more than doubled from 1984 to 2004 (Figure 2), also in keeping with the increase in incidence.
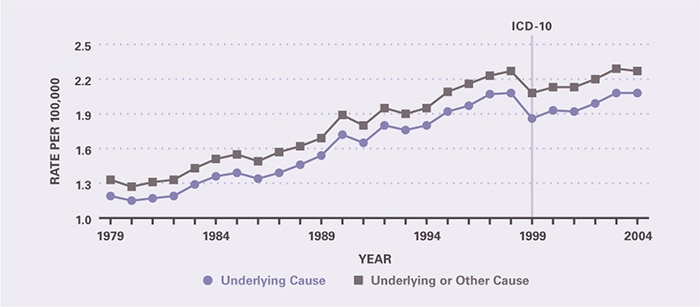
Death rates increased with age, but not as markedly as in other digestive system cancers (Table 3). Age-adjusted death rates were higher among blacks and males. Because of its increasing incidence and poor survival, primary liver cancer has contributed an increasing number and proportion of deaths, although it accounted for only 4.7 percent of all deaths from digestive system cancers in 2004. Because of the relatively early age of onset, it accounted for a higher proportion of YPLL due to digestive system cancers (7.7 percent). As with incidence, mortality rate increased, although not as quickly. The mortality rate increased 75 percent between 1979 and 2004 (Figure 3).
Table 1. Primary Liver Cancer: Number of Cases and Incidence Rate by Age, Race/Ethnicity, and Sex, 2004
| Demographic Characteristics | Number of Cases | Incidence per 100,000 Unadjusted | Incidence per 100,000 Age-Adjusted |
|---|---|---|---|
| AGE (Years) Under 15 |
165 | 0.3 | — |
| AGE (Years) 15–44 |
856 | 0.7 | — |
| AGE (Years) 45–64 |
7,863 | 11.2 | — |
| AGE (Years) 65+ |
8,093 | 23.7 | — |
| RACE/ETHNICITY Non-Hispanic White |
9,507 | 4.9 | 4.2 |
| RACE/ETHNICITY Non-Hispanic Black |
2,244 | 6.6 | 8.3 |
| RACE/ETHNICITY Hispanic |
1,894 | 4.7 | 9.0 |
| RACE/ETHNICITY Asian/Pacific Islander |
1,414 | 11.5 | 12.9 |
| RACE/ETHNICITY American Indian/Alaska Native |
151 | 8.2 | 10.0 |
| Sex Female |
4,350 | 3.0 | 2.8 |
| Sex Male |
11,827 | 8.5 | 9.4 |
| Total | 16,260 | 5.7 | — |
Figure 1. Primary Liver Cancer: Age-Adjusted Incidence Rates and 5-Year Survival Rates, 1979–2004
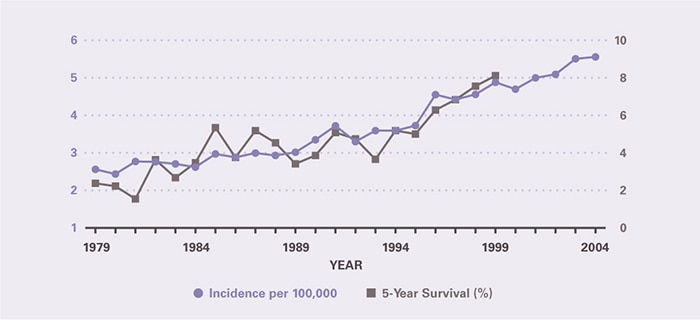
Table 2. Primary Liver Cancer: Number and Age-Adjusted Rates of Ambulatory Care Visits and Hospital Discharges With First-Listed and All-Listed Diagnoses by Age, Race, and Sex in the United States, 2004
| Demographic Characteristics | Ambulatory Care Visits First-Listed Diagnosis Number in Thousands | Ambulatory Care Visits First-Listed Diagnosis Rate per 100,000 | Ambulatory Care Visits All-Listed Diagnosis Number in Thousands | Ambulatory Care Visits All-Listed Diagnosis Rate per 100,000 | Hospital Discharges First-Listed Diagnosis Number in Thousands | Hospital Discharges First-Listed Diagnosis Rate per 100,000 | Hospital Discharges All-Listed Diagnosis Number in Thousands | Hospital Discharges All-Listed Diagnosis Rate per 100,000 |
|---|---|---|---|---|---|---|---|---|
| AGE (Years) Under 15 |
— | — | — | — | 0 | 1 | 2 | 3 |
| AGE (Years) 15–44 |
— | — | — | — | 1 | 1 | 2 | 2 |
| AGE (Years) 45–64 |
— | — | — | — | 6 | 9 | 15 | 21 |
| AGE (Years) 65+ |
— | — | — | — | 6 | 17 | 14 | 39 |
| Race White |
— | — | — | — | 10 | 4 | 25 | 10 |
| Race Black |
— | — | — | — | 2 | 7 | 5 | 14 |
| Sex Female |
— | — | — | — | 4 | 3 | 9 | 6 |
| Sex Male |
— | — | — | — | 10 | 7 | 23 | 17 |
| Total | — | — | 63 | 21 | 14 | 5 | 33 | 11 |
Figure 2. Primary Liver Cancer: Age-Adjusted Rates of Ambulatory Care Visits and Hospital Discharges With All–Listed Diagnoses in the United States, 1979–2004
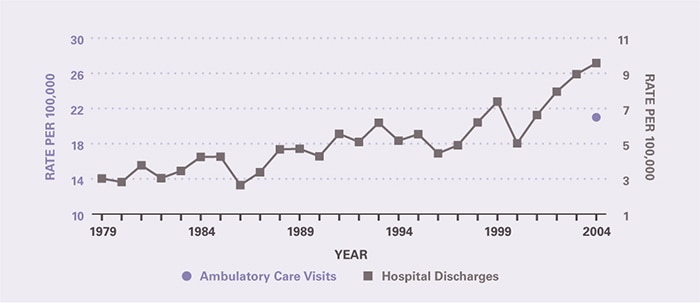
Table 3. Primary Liver Cancer: Number and Age-Adjusted Rates of Deaths and Years of Potential Life Lost (to Age 75) by Age, Race, and Sex in the United States, 2004
| Demographic Characteristics | Underlying Cause Number of Deaths | Underlying Cause Rate per 100,000 | Underlying Cause Years of Potential Life Lost in Thousands | Underlying or Other Cause Number of Deaths | Underlying or Other Cause Rate per 100,000 |
|---|---|---|---|---|---|
| AGE (Years) Under 15 |
33 | 0.1 | 2.3 | 34 | 0.1 |
| AGE (Years) 15–44 |
243 | 0.2 | 9.1 | 250 | 0.2 |
| AGE (Years) 45–64 |
2,781 | 3.9 | 53.9 | 3,069 | 4.3 |
| AGE (Years) 65+ |
3,266 | 9.0 | 7.2 | 3,567 | 9.8 |
| Race White |
4,742 | 1.8 | 49.8 | 5,204 | 2.0 |
| Race Black |
944 | 3.1 | 14.7 | 1,021 | 3.4 |
| Sex Female |
1,522 | 0.9 | 12.0 | 1,666 | 1.0 |
| Sex Male |
4,801 | 3.5 | 60.4 | 5,254 | 3.9 |
| Total | 6,323 | 2.2 | 72.4 | 6,920 | 2.4 |
Figure 3. Primary Liver Cancer: Age-Adjusted Rates of Death in the United States, 1979–2004
This content is provided as a service of the National Institute of Diabetes and Digestive and Kidney Diseases
(NIDDK), part of the National Institutes of Health. NIDDK translates and disseminates research findings to increase knowledge and understanding about health and disease among patients, health professionals, and the public. Content produced by NIDDK is carefully reviewed by NIDDK scientists and other experts.