


Chapter 11: Cancer of the Gallbladder
James E. Everhart, M.D., M.P.H.
About 3,000 cases of gallbladder cancer were estimated to have occurred in 2004 (Table 1). Gallbladder cancer was the only digestive system malignancy that occurred predominantly among women (nearly twice the age-adjusted rate of men) and was one of the few nongenital cancers that had a female predominance. It was predominantly a diagnosis of the elderly, with a median age of diagnosis of age 73 years (PDF, 28 KB) , the highest of any digestive system cancer. Age-adjusted rates were too low to draw inferences about ethnic differences in risk. Incidence of gallbladder cancer declined by 42.2 percent from 1979 to 1997, and was then stable through 2004 (Figure 1). Five-year survival increased modestly to about 9 percent. Outpatient and inpatient data were too sparse to draw inferences, except that the rate of hospitalization with gallbladder cancer declined substantially until the mid-1990s and has been stable since (Figure 2).
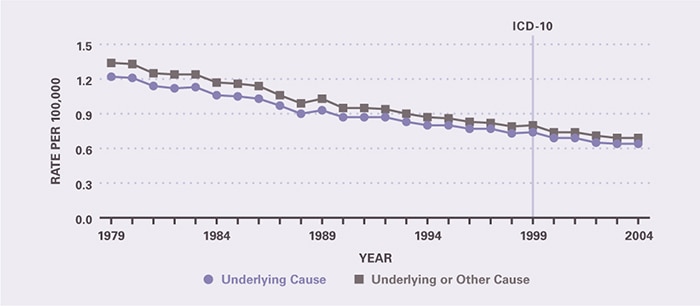
Because of low survival, gallbladder cancer mortality was similar to incidence. As underlying cause, there were nearly 2,000 deaths in 2004 and just under 11,000 YPLL prior to age 75 years (Table 3), which reflects the older age at which gallbladder cancer occurred. Rates were 6.8 times as high in the oldest age group (65 years and older) as among those ages 45–64 years. Age-adjusted mortality rates were higher for blacks than whites, and for females than males. The death rate for gallbladder cancer declined by 47 percent between 1979 and 2004 (Figure 3). Because gallstones are the major recognized risk factor for gallbladder cancer, it is of interest that there was a similar decline (56.1 percent) in gallstone disease-related mortality over that period.
Table 1. Gallbladder Cancer: Number of Cases and Incidence Rates by Age, Race/Ethnicity, and Sex, 2004
| Demographic Characteristics | Number of Cases | Incidence per 100,000 Unadjusted | Incidence per 100,000 Age-Adjusted |
|---|---|---|---|
| AGE (Years) Under 15 |
— | — | — |
| AGE (Years) 15–44 |
79 | 0.1 | — |
| AGE (Years) 45–64 |
850 | 1.2 | — |
| AGE (Years) 65+ |
2,257 | 6.6 | — |
| RACE/ETHNICITY Non-Hispanic White |
2,129 | 1.1 | 0.9 |
| RACE/ETHNICITY Non-Hispanic Black |
356 | 1.0 | 1.5 |
| RACE/ETHNICITY Hispanic |
348 | 0.9 | 1.9 |
| RACE/ETHNICITY Asian/Pacific Islander |
142 | 1.2 | 1.4 |
| RACE/ETHNICITY American Indian/Alaska Native |
— | — | — |
| Sex Female |
2,180 | 1.5 | 1.4 |
| Sex Male |
867 | 0.6 | 0.8 |
| Total | 3,034 | 1.1 | — |
Figure 1. Gallbladder Cancer: Age-Adjusted Incidence Rates and 5-Year Survival Rates, 1979–2004
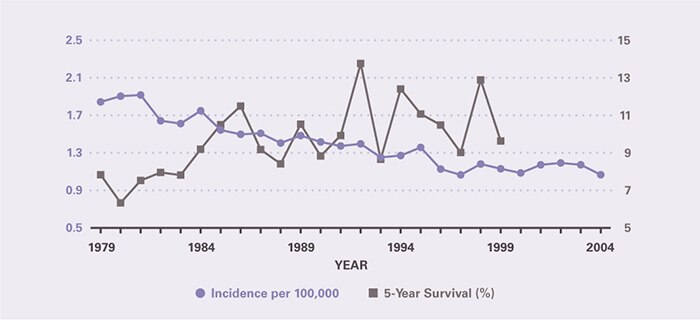
Table 2. Gallbladder Cancer: Number and Age-Adjusted Rates of Ambulatory Care Visits and Hospital Discharges With First-Listed and All-Listed Diagnoses by Age, Race, and Sex in the United States, 2004
| Demographic Characteristics | Ambulatory Care Visits First-Listed Diagnosis Number in Thousands | Ambulatory Care Visits First-Listed Diagnosis Rate per 100,000 | Ambulatory Care Visits All-Listed Diagnosis Number in Thousands | Ambulatory Care Visits All-Listed Diagnosis Rate per 100,000 | Hospital Discharges First-Listed Diagnosis Number in Thousands | Hospital Discharges First-Listed Diagnosis Rate per 100,000 | Hospital Discharges All-Listed Diagnosis Number in Thousands | Hospital Discharges All-Listed Diagnosis Rate per 100,000 |
|---|---|---|---|---|---|---|---|---|
| AGE (Years) Under 15 |
— | — | — | — | — | — | — | — |
| AGE (Years) 15–44 |
— | — | — | — | — | — | 0 | 0 |
| AGE (Years) 45–64 |
— | — | — | — | 1 | 1 | 1 | 2 |
| AGE (Years) 65+ |
— | — | — | — | 2 | 6 | 4 | 11 |
| Race White |
— | — | — | — | 2 | 1 | 5 | 2 |
| Race Black |
— | — | — | — | 0 | 1 | 1 | 2 |
| Sex Female |
— | — | — | — | 2 | 1 | 4 | 2 |
| Sex Male |
— | — | — | — | 1 | 1 | 2 | 1 |
| Total | — | — | — | — | 3 | 1 | 6 | 2 |
Figure 2. Gallbladder Cancer: Age-Adjusted Rates of Ambulatory Care Visits and Hospital Discharges With All–Listed Diagnoses in the United States, 1979–2004 (Ambulatory Care Visit Data Unavailable)
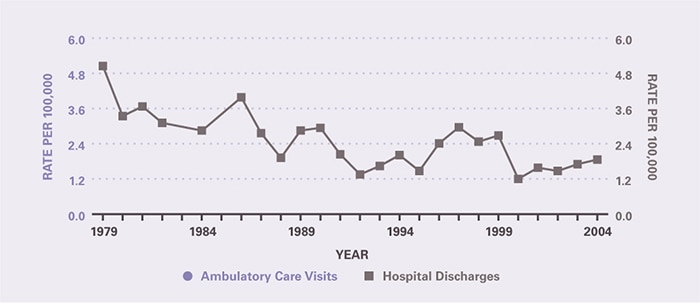
Table 3. Gallbladder Cancer: Number and Age-Adjusted Rates of Deaths and Years of Potential Life Lost (to Age 75) by Age, Race, and Sex in the United States, 2004
| Demographic Characteristics | Underlying Cause Number of Deaths | Underlying Cause Rate per 100,000 | Underlying Cause Years of Potential Life Lost in Thousands | Underlying or Other Cause Number of Deaths | Underlying or Other Cause Rate per 100,000 |
|---|---|---|---|---|---|
| AGE (Years) Under 15 |
— | — | — | — | — |
| AGE (Years) 15–44 |
41 | 0.0 | 1.5 | 44 | 0.0 |
| AGE (Years) 45–64 |
422 | 0.6 | 7.1 | 443 | 0.6 |
| AGE (Years) 65+ |
1,476 | 4.1 | 2.3 | 1,585 | 4.4 |
| Race White |
1,600 | 0.6 | 8.5 | 1,715 | 0.7 |
| Race Black |
227 | 0.9 | 1.6 | 239 | 0.9 |
| Sex Female |
1,343 | 0.8 | 7.4 | 1,422 | 0.8 |
| Sex Male |
596 | 0.5 | 3.5 | 650 | 0.5 |
| Total | 1,939 | 0.7 | 10.9 | 2,072 | 0.7 |
Figure 3. Gallbladder Cancer: Age-Adjusted Rates of Death in the United States, 1979–2004
This content is provided as a service of the National Institute of Diabetes and Digestive and Kidney Diseases
(NIDDK), part of the National Institutes of Health. NIDDK translates and disseminates research findings to increase knowledge and understanding about health and disease among patients, health professionals, and the public. Content produced by NIDDK is carefully reviewed by NIDDK scientists and other experts.